
Can Rate Cuts Ease Housing Costs?
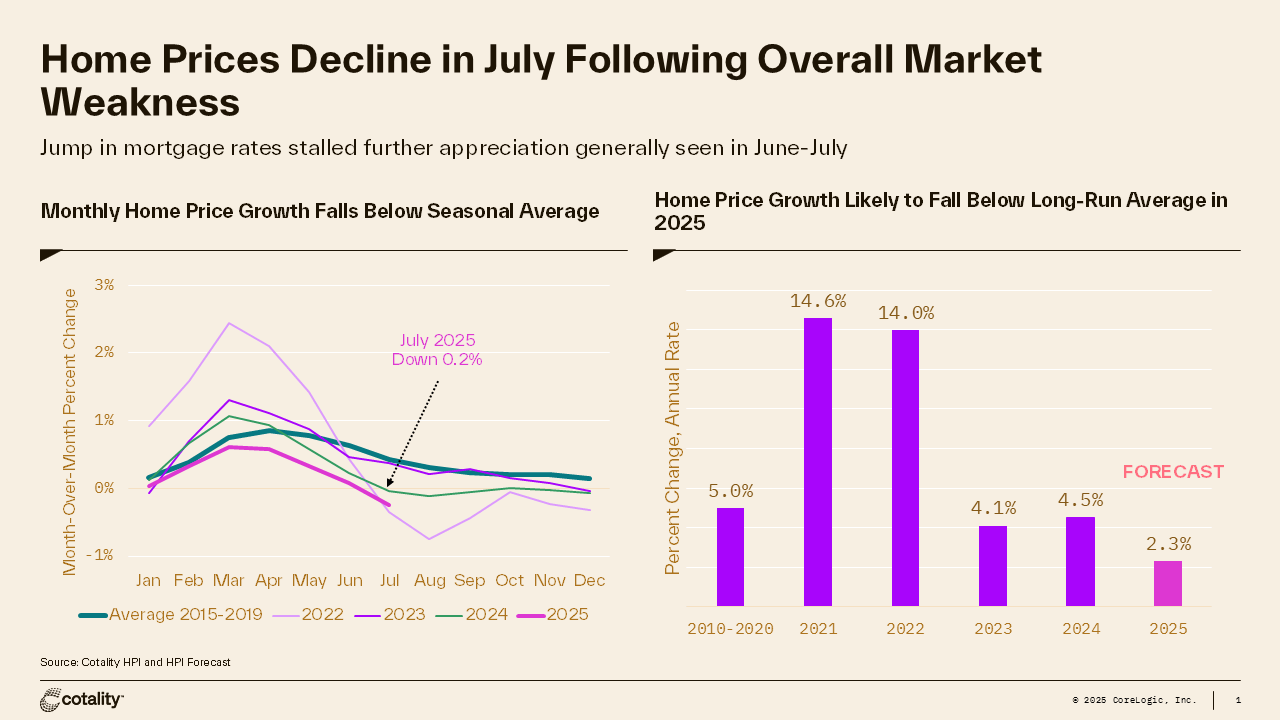
Most recent Cotality’s Home Price Insights indicated a continued slowdown in home prices which were up 1.4% compared to last July. This is now the slowest rate of home price appreciation since 2012. However, while annual slowdown has been on the way, home prices in July fell compared to June, down 0.24%, an atypical trend that we only saw during the 2006-2008 crisis and in 2022. Home prices typically increase in July with an average of 0.4% recorded between 2015 and 2019.
As Figure 1 shows, although the rate of price growth has moderated this year, the monthly pattern is similar to that of 2024, when an increase in mortgage rates in April slowed the housing market’s improvement and caused home prices to plateau. Likewise, a rise in mortgage rates this April weakened home buyer demand, which limited seasonal price increases and led to a decline in July.
After last year’s deceleration in prices, the second half of 2024 remained mostly stable, with a noted decrease in mortgage rates during early fall possibly contributing to price stabilization. This year, mortgage rates again declined after the September 5th BLS employment report, which could support home price stability through the fall. In fact, the recent 20 basis point decline in mortgage rates, to 6.3%, brought the rates to the lowest levels in almost a year and has boosted mortgage application activity, with purchase applications in August and September averaging the highest year-over-year increase in four years.
And while this painfully slow improvement in housing demand has yet to reflect in home price changes, it will likely limit further monthly declines and stabilize prices for the remainder of the year. Cotality forecasts a small monthly positive increase, up 0.24% in August.
Regionally, home price trends remain bifurcated with most of the Northeast and Midwest continuing to see rising prices and Florida, parts of Texas and the West seeing price declines. And while price cooldown appears to be spreading across more markets, it remains concentrated in regions that have been experiencing weakness throughout 2025.
The changes in the metro-level Home Price Index between July and April 2025. Nationally, the home price index rose 0.1% during this period while some 30% of about 411 metropolitan areas in the U.S. saw declines. The largest declines, again, remain in Florida and the West, where home prices have been cooling for most of the year. In contrast, areas of Midwest and affordable markets of Northeast continued to see robust summer gains which in most of these ‘hot’ markets exceeded the typical gains for this time of the year.
In understanding what’s driving recent price declines in some regions, other than for example, affordability, insurance and property tax increases, weakened demand since the pre-pandemic and pandemic boost is important to consider. Some of the areas with largest declines are also areas where net domestic migration has slowed considerably in the last year.
The top six states where net domestic migration has slowed the most and the top six where it has accelerated the most in 2024 compared to 2019. The areas almost perfectly align with changes in home prices. And again, while Florida still has the fourth largest net domestic in-migration states (following Texas, North and South Carolinas), the net domestic migration to Florida has slowed notably. In contrast, New York state has seen the largest increase in domestic in-migration and continues to be the state where most metros continue to log in robust home price gains.
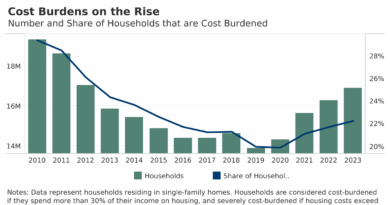
However, as detailed in the previous month’s newsletter, a broad decline in home prices may be cause for concern, particularly during periods of potential economic recession and rising unemployment, which can result in a greater number of homeowners experiencing financial hardship. Thus, an important trend to keep an eye on.
The long-term trend in distribution of home price changes across markets, highlighting a recent increase to 20% in the proportion of markets experiencing declining prices. A comparable rise was also observed in early 2023, which followed higher mortgage rates and subsequent price decreases in certain markets. It’s interesting to note that throughout the 1980s and 1990s, the share of declining markets was elevated yet the change in the national home price index remained positive.
Now, what does that all mean for affordability and will housing affordability improve with potential Federal Reserve rate cuts? It’s a complex question with multiple factors at play. While a Fed rate cut is generally seen as a positive sign for the housing market, it does not guarantee a major improvement in affordability.
First, the Federal Reserve does not directly set mortgage rates. The Fed manages the federal funds rate, which is the short-term interest rate that banks use for overnight lending to each other. Mortgage rates are typically influenced by the yield on the 10-year Treasury note. Although both rates often trend in the same direction over time, discrepancies and delays can occur. For instance, mortgage rates may decrease ahead of an anticipated Fed rate cut, or they may stay elevated after a cut due to other factors such as ongoing inflation or strength in the labor market.
Affordability depends on both home prices and borrowing costs, and while a Fed rate cut can potentially affect each, it does not always result in significant improvement since lower rates may drive up home prices: when mortgage rates drop, monthly payments become lower, which makes homeownership more accessible to more individuals. Additionally, reduced rates increase buyers’ purchasing power, enabling them to afford more expensive homes without raising their monthly payment.
When mortgage rates decrease, more buyers typically enter the market. This increase in demand creates greater competition among buyers, which can push home prices higher. In some regions, these rising prices may offset the financial advantages of lower mortgage rates, resulting in little overall improvement in affordability.
And finally, the housing market is influenced by a range of variables beyond just interest rates. Limited housing supply remains a significant challenge for affordability, as many homeowners with low mortgage rates are staying out of the market, restricting available inventory. Even if the Federal Reserve cuts rates, this may not significantly increase seller activity.
Income and wage growth also play a role in supporting affordability; however, when home prices and interest rates climb faster than wages, affordability concerns persist. Additionally, affordability trends vary across the country: some regions, particularly in the South and West, are seeing price declines due to growing inventory, whereas the Northeast and Midwest continue to experience rising prices as inventory stays low.
Dr. Selma Hepp is the Chief Economist for Cotality. She may be reached at newsmedia@cotality.com