
10 Things to Know About the Property Market
Cotality, a leading global property information, analytics and data-enabled solutions provider, released its latest list on the 10 things to know about the property market for January 2026.
The U.S. housing market comes into 2026 out of a transitional phase: In 2025, price growth cooled, regional performance diverged, and demand recalibrated amid shifting costs and credit conditions. Strong home prices in parts of the Northeast and Midwest contrasted with pronounced softening in Florida and Texas, and some large metros show large slowdowns. Affordability remains a central pressure point – only about half of U.S. metros are still affordable when taxes and insurance are added and reconstruction costs rising far faster than general inflation.
Cotality saw post‑disaster recovery patterns that underscore a growing role for investors, even as policy debates around large investors exceed their measurable market share. The affordability crisis could worsen as all-cash buyers receive bigger discounts, and financed buyers face a larger payment burden. Single‑family rent growth has also cooled to 15‑year lows, with declines across many major metros. Looking ahead into 2026, easing mortgage rates may increase home buying activity, but we expect the limited supply and non-mortgage expenses to keep competition uneven and buying outcomes to be highly local.
Housing Market Trends
- Home price growth slowed sharply at the end of 2025, but regional differences are widening. National price appreciation grew by just 1% year‑over‑year in November, even as some Northeast and Midwest metros gained momentum. Meanwhile, parts of Florida and Texas saw the steepest declines. Washington, D.C., also became the second‑fastest‑declining market. Looking to 2026, we expect easing mortgage rates and improving affordability to revive buyer activity, though tight inventory will keep competition elevated in many desirable areas.
- Homes in major Florida cities are taking longer to sell. The median Miami house that went to contract in December 2025 spent a whopping 69 days on the market, well over the national median of 47 days and 2 days longer than in September. Other Florida cities also saw slow movement in December—with 58 median days on market in Tampa, up 5 days compared to 3 months ago; 67 days in Orlando, up 7 days; and 57 days in Jacksonville, up 5 days. Inventory levels in Miami and Jacksonville were roughly unchanged compared to a year ago, but Tampa and Orlando each saw a roughly 10% year-over-year increase in the 4th quarter.
- The housing market has cooled dramatically in both New York City and Austin, Texas. Total home sales for the fourth quarter were down in each city by nearly 30% year over year, a much bigger decrease than was seen in any other major metro area, and well over the national average 1% year-over-year decline. Another sign of the cooling market? Both cities also saw a sharp increase in both days on market and inventory. New York’s median days until contract increased by 20 days compared to September, sitting at 51 days in December 2025. In Austin, time on the market went up—from 24 days to 67. Fourth quarter inventory was up 24% year-over-year in New York and 16% year-over-year in Austin.
- One year after the Santa Ana–driven wildfires, the data shows recovery in California is being shaped more by investors than returning residents. According to Cotality analysis, 6.6% of the destroyed properties, or roughly 694 homes, have been resold in the past year, a rate far higher than for homes with minor or no damage. Nearly half (45%) of these sales went to investors. When you add in buyers using LLCs and other corporate structures to purchase vacant lots, the share of properties sold to investors or companies jumps to approximately 77%.
- A national ban on institutional home buying may sound significant, but the data shows its effect would be modest. While large investors attract a great deal of attention, Cotality data shows they buy only about 3% of single‑family homes nationally, meaning a ban would barely shift supply. The market dynamics would also remain unchanged because the proposal doesn’t require investors to sell existing homes. Banning these buyers could also reduce rental availability for families who aren’t ready to purchase.
- Annual single-family rent growth stayed at 15-year lows, slowing to a 1.1% pace in November. The cooling is widespread, with 43 of the 50 largest metros seeing slower November growth and 16 registering outright decreases. Florida leads in annual declines, while Chicagoland metros top the list for increases. Even the high-end rentals that were booming have started to level out, with growth finally steadying across the board.
Mortgage Market Trends
- Cash buyers are securing big discounts. Sellers gave an average 9% discount on all‑cash home purchases in 2025, up sharply from 4% in 2021. They’re willing to give the discounts as higher interest rates and rising purchase cancelations make certainty and speed more valuable. This will speed up the affordability crisis- as cash buyers have an advantage over financed buyers who will have to stretch their budgets and bid higher to purchase a new home.
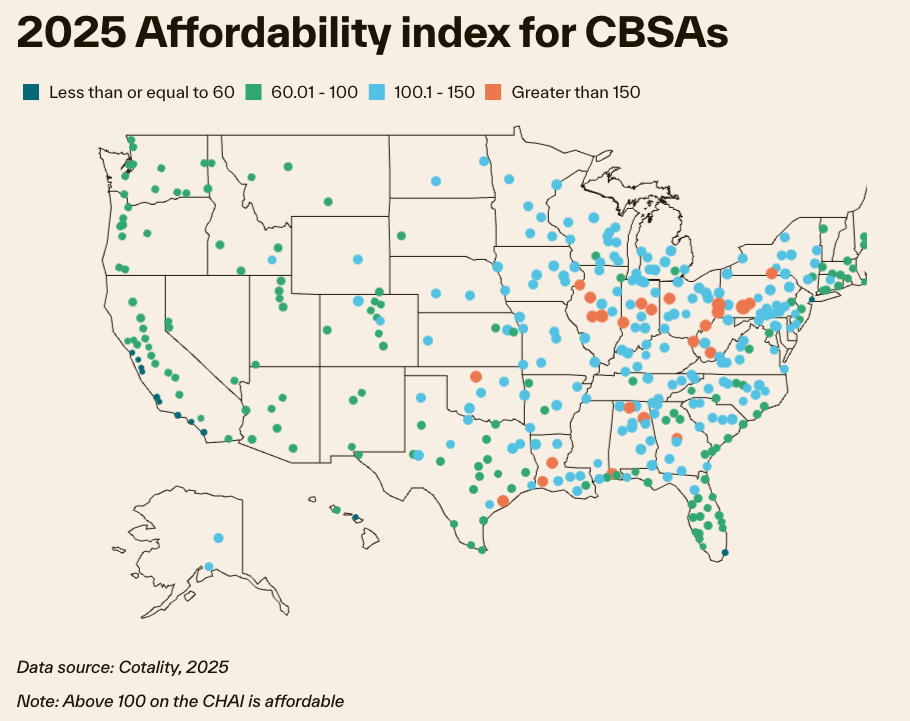
- Affordability varies sharply across U.S. metros. According to the Cotality affordability index, only 56% of metros are still affordable to the median household when taxes and insurance are included. In many places, escrow costs alone make up more than 40% of the monthly payment. As a result, high non‑mortgage costs make owning a home less affordable and put families at risk if their monthly payments suddenly jump.
- The escrow squeeze has led to a stark drop in the national housing market. The markets where people can afford to buy have plummeted by 40% in 10 years, dropping from 354 in 2014 to just 212 in 2025. Regions with high affordability (indexing at 200+) have nearly disappeared, shrinking from 41 markets in 2014 to just four today.
- Residential reconstruction costs continue to outpace overall inflation. Cotality data shows residential reconstruction costs rose 6.6% year over year in January 2025, more than twice the rate of overall inflation, potentially creating coverage gaps for homeowners. Homeowners are seeing repair and rebuilding costs climb because of the increased price of materials.