












The housing market finally feels more normal. Buyers have more choices, bidding wars have become less common and builders are once again competing through incentives, pricing and product mix, rather than simply selling into a market defined by scarcity. New-home months’ supply has recently moved above 10 months, well above its 5.8-month pre-pandemic average from 2000 through 2019. Resale inventory has also increased across much of the country, even if it remains below historical norms nationally.
Those developments have restored a measure of normalcy to the housing market, but they also raise an important question: Has the market worked through its long-running supply shortage? Measures such as months’ supply provide a useful snapshot of current market conditions because they reflect both the number of homes on the market and the pace at which homes are selling. So, that means months’ supply can improve when inventory rises, sales slow or a mix of both. While it is a useful measure of near-term market balance, it does not necessarily tell us whether the housing market has restored the normal level of for-sale vacancy associated with a healthy market.
A healthy housing market needs more than homes currently listed for sale. It also needs a modest stock of homeowner inventory which is vacant for sale. That vacancy cushion allows households to relocate, grow, downsize and move as their housing needs change without creating persistent upward pressure on prices. When vacant homes for sale fall well below their historical norm, the market has less flexibility to accommodate those everyday transitions.
Comparing today’s homeowner vacancy rate with its 1993-2003 average provides a useful way to evaluate that longer-run balance. We use that period as a reference point because it predates the housing boom and bust and offers a relatively stable pre-boom benchmark for normal for-sale vacancy. Unlike for-sale inventory, which measures how many homes are currently on the market, the homeowner vacancy rate measures the share of owner-side housing stock that is vacant and available for sale.
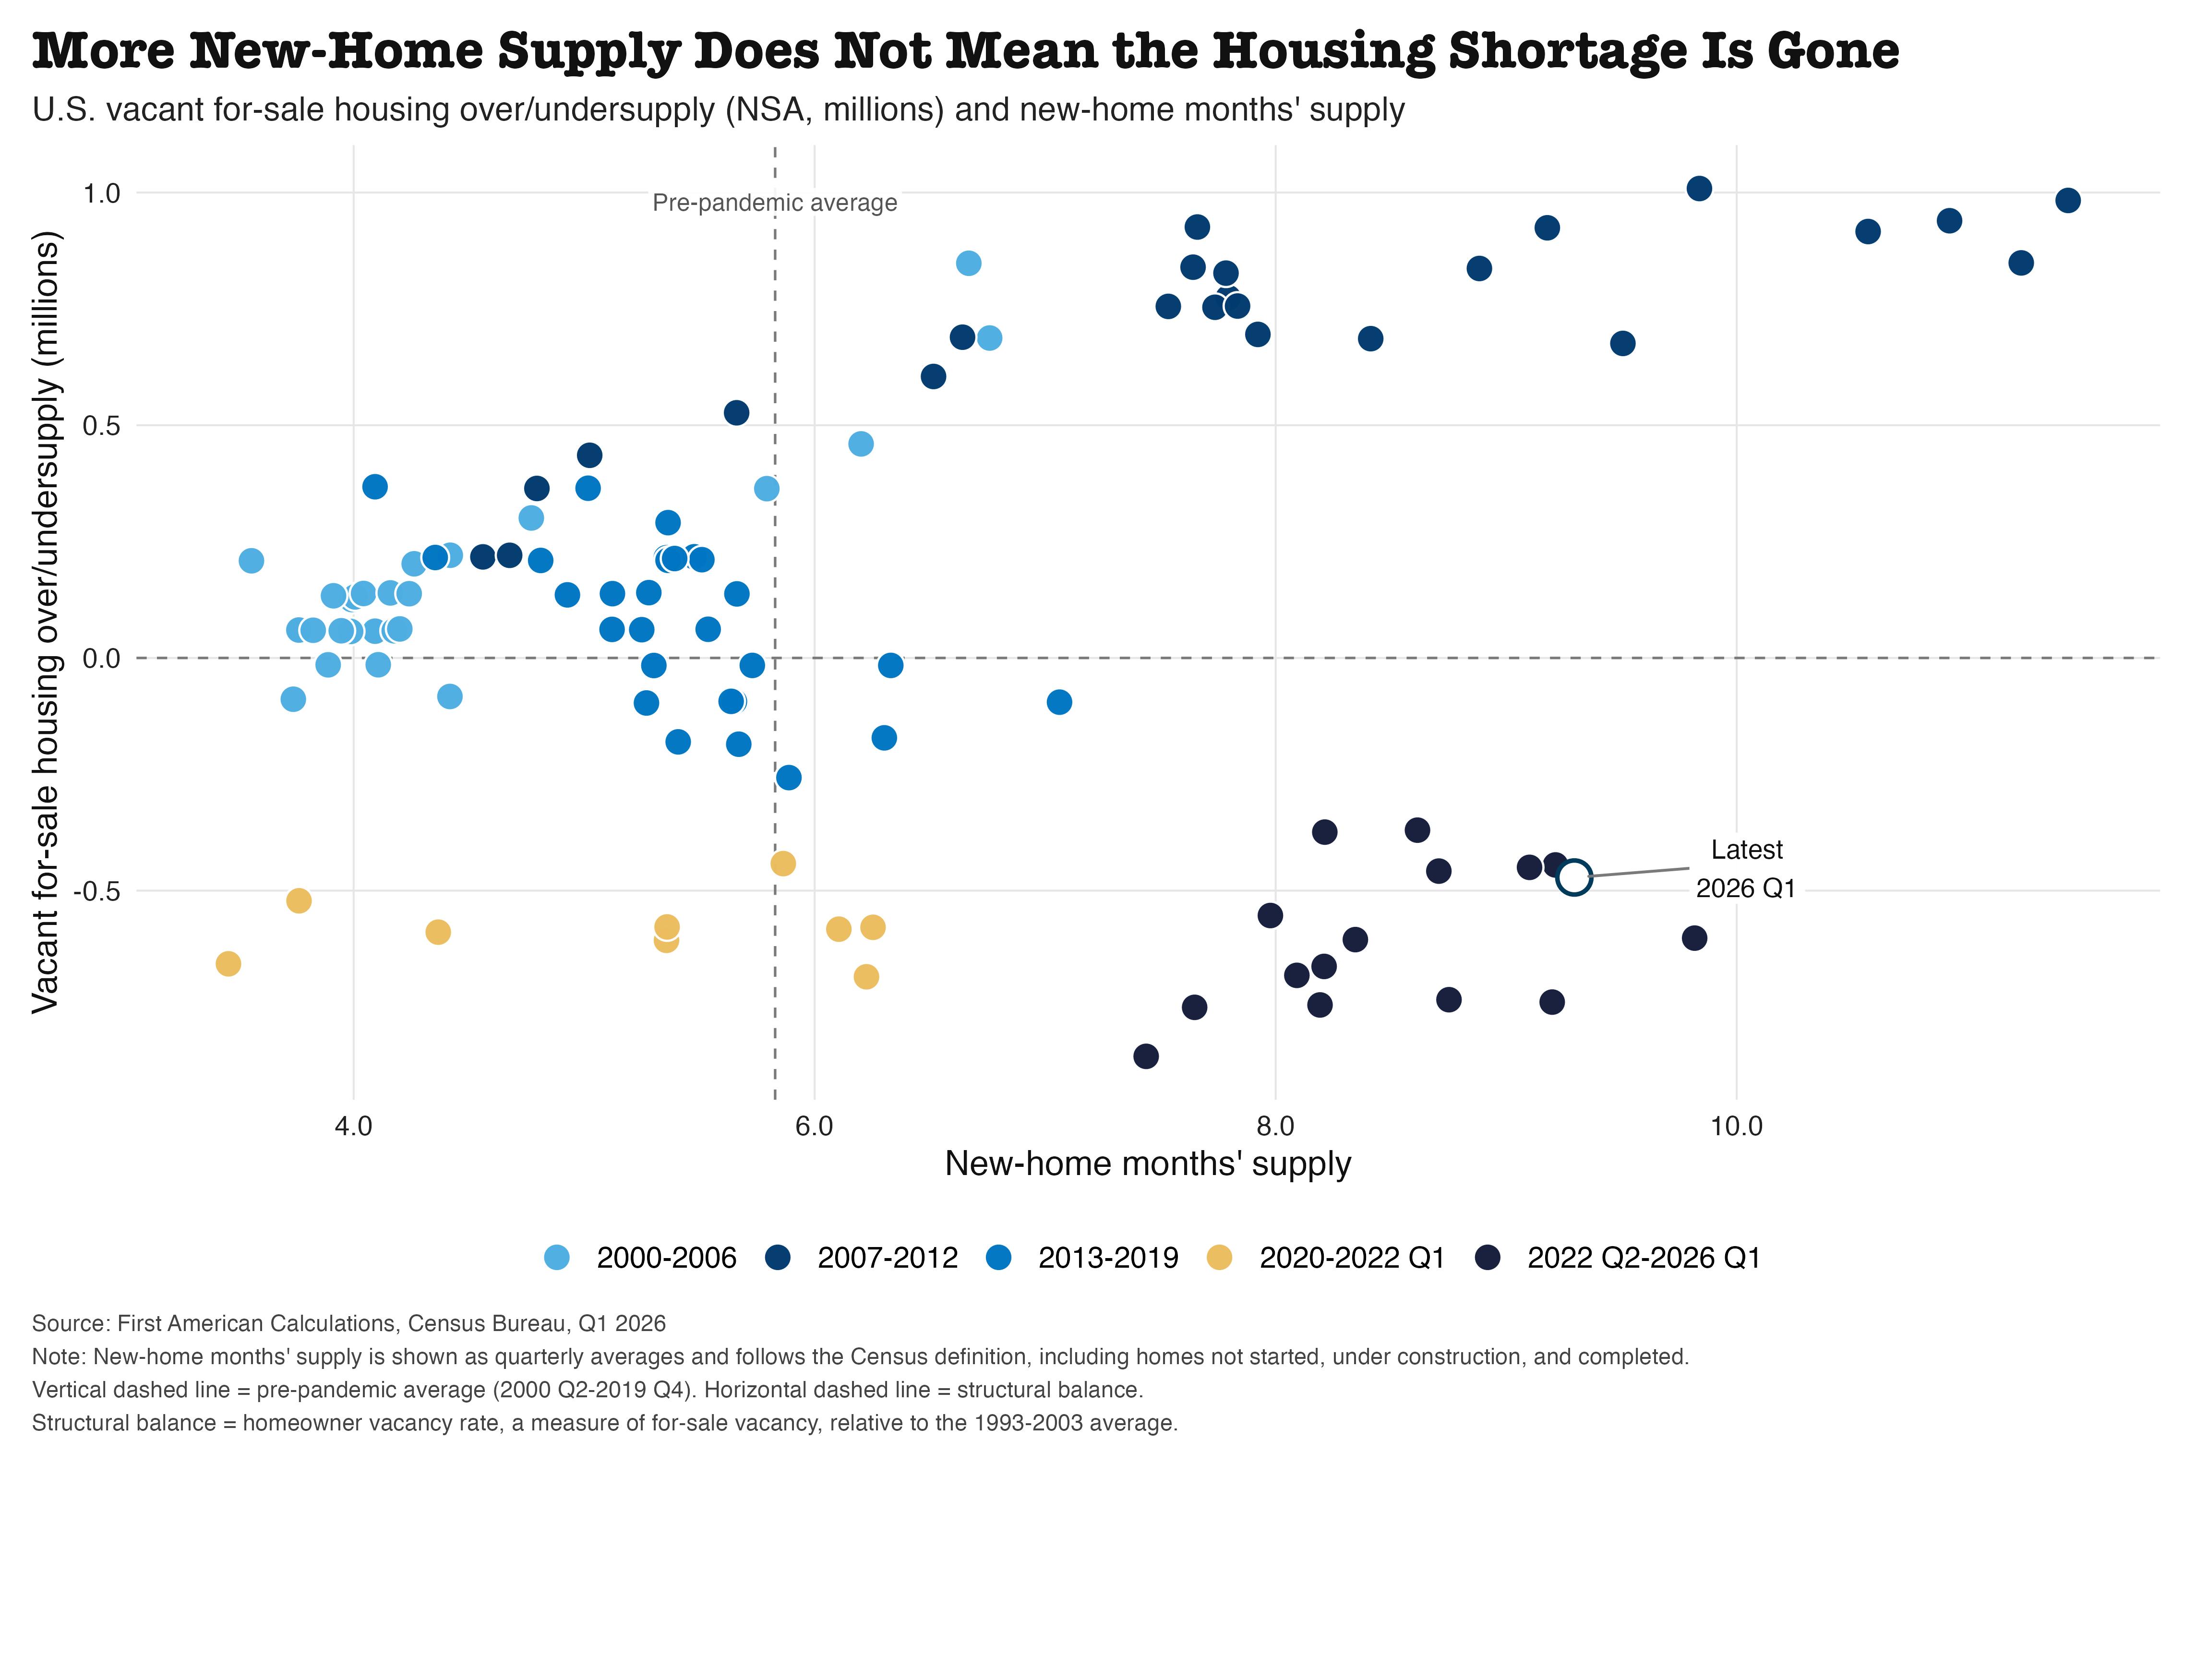
The chart compares these two perspectives. The horizontal axis tracks the level of new-home months’ supply, a short-run market-balance measure that reflects both the number of new homes available for sale and the pace at which they are selling. The dashed vertical line marks the pre-pandemic average from 2000 through 2019. The vertical axis measures the structural balance of the for-sale housing market using the homeowner vacancy rate relative to its 1993-2003 average. Values below zero indicate a structural shortage, zero indicates balance and values above zero indicate structural surplus.
The path through the chart tells the story. During the pandemic housing boom, builders were selling into an exceptionally tight market characterized by historically low months’ supply and very little for-sale vacancy. Over the past several years, new-home months’ supply recovered rapidly as builders completed more homes and demand moderated in a higher-rate environment. Movement along the vertical axis, however, has been much slower. Although the homeowner vacancy rate has improved from its lows, it still points to a structural shortage of nearly 500,000 fewer vacant homes for sale than would be implied by the historical homeowner vacancy norm.
Viewed together, the chart suggests the new-home market has returned to a more balanced selling environment faster than the broader for-sale market has rebuilt its normal level of vacancy. At first glance, those observations may seem contradictory, but they’re measuring different things. Inventory responds relatively quickly to changes in construction activity and sales, while homeowner vacancy reflects the slower process of rebuilding the market’s normal level of available homes. That’s why today’s market can feel considerably healthier than it did during the pandemic housing boom, while still reflecting the cumulative effects of years of underbuilding.
Looking ahead to the second half of 2026, builders are likely to continue operating in a softer, more competitive market than they experienced during the pandemic housing boom. Higher new-home inventory, coupled with improving resale supply in many markets, means sales will continue to depend on affordability, incentives and product positioning.
The longer-run adjustment has been much slower. The homeowner vacancy rate suggests the market has not yet restored the level of for-sale vacancy that historically characterized a balanced housing market. Rebuilding that vacancy cushion takes considerably longer because it depends on expanding the stock of homes available for sale over time, rather than changes in demand or listings over the course of a few months.
Inventory has recovered meaningfully since the pandemic, but restoring structural housing balance takes considerably longer. That suggests the underlying need for additional housing continues to support residential construction, even as builders navigate a softer and more competitive near-term selling environment.
By Odeta Kushi. She is the deputy chief economist at First American. She can be reached here.
This is the full column, read the print version here.