


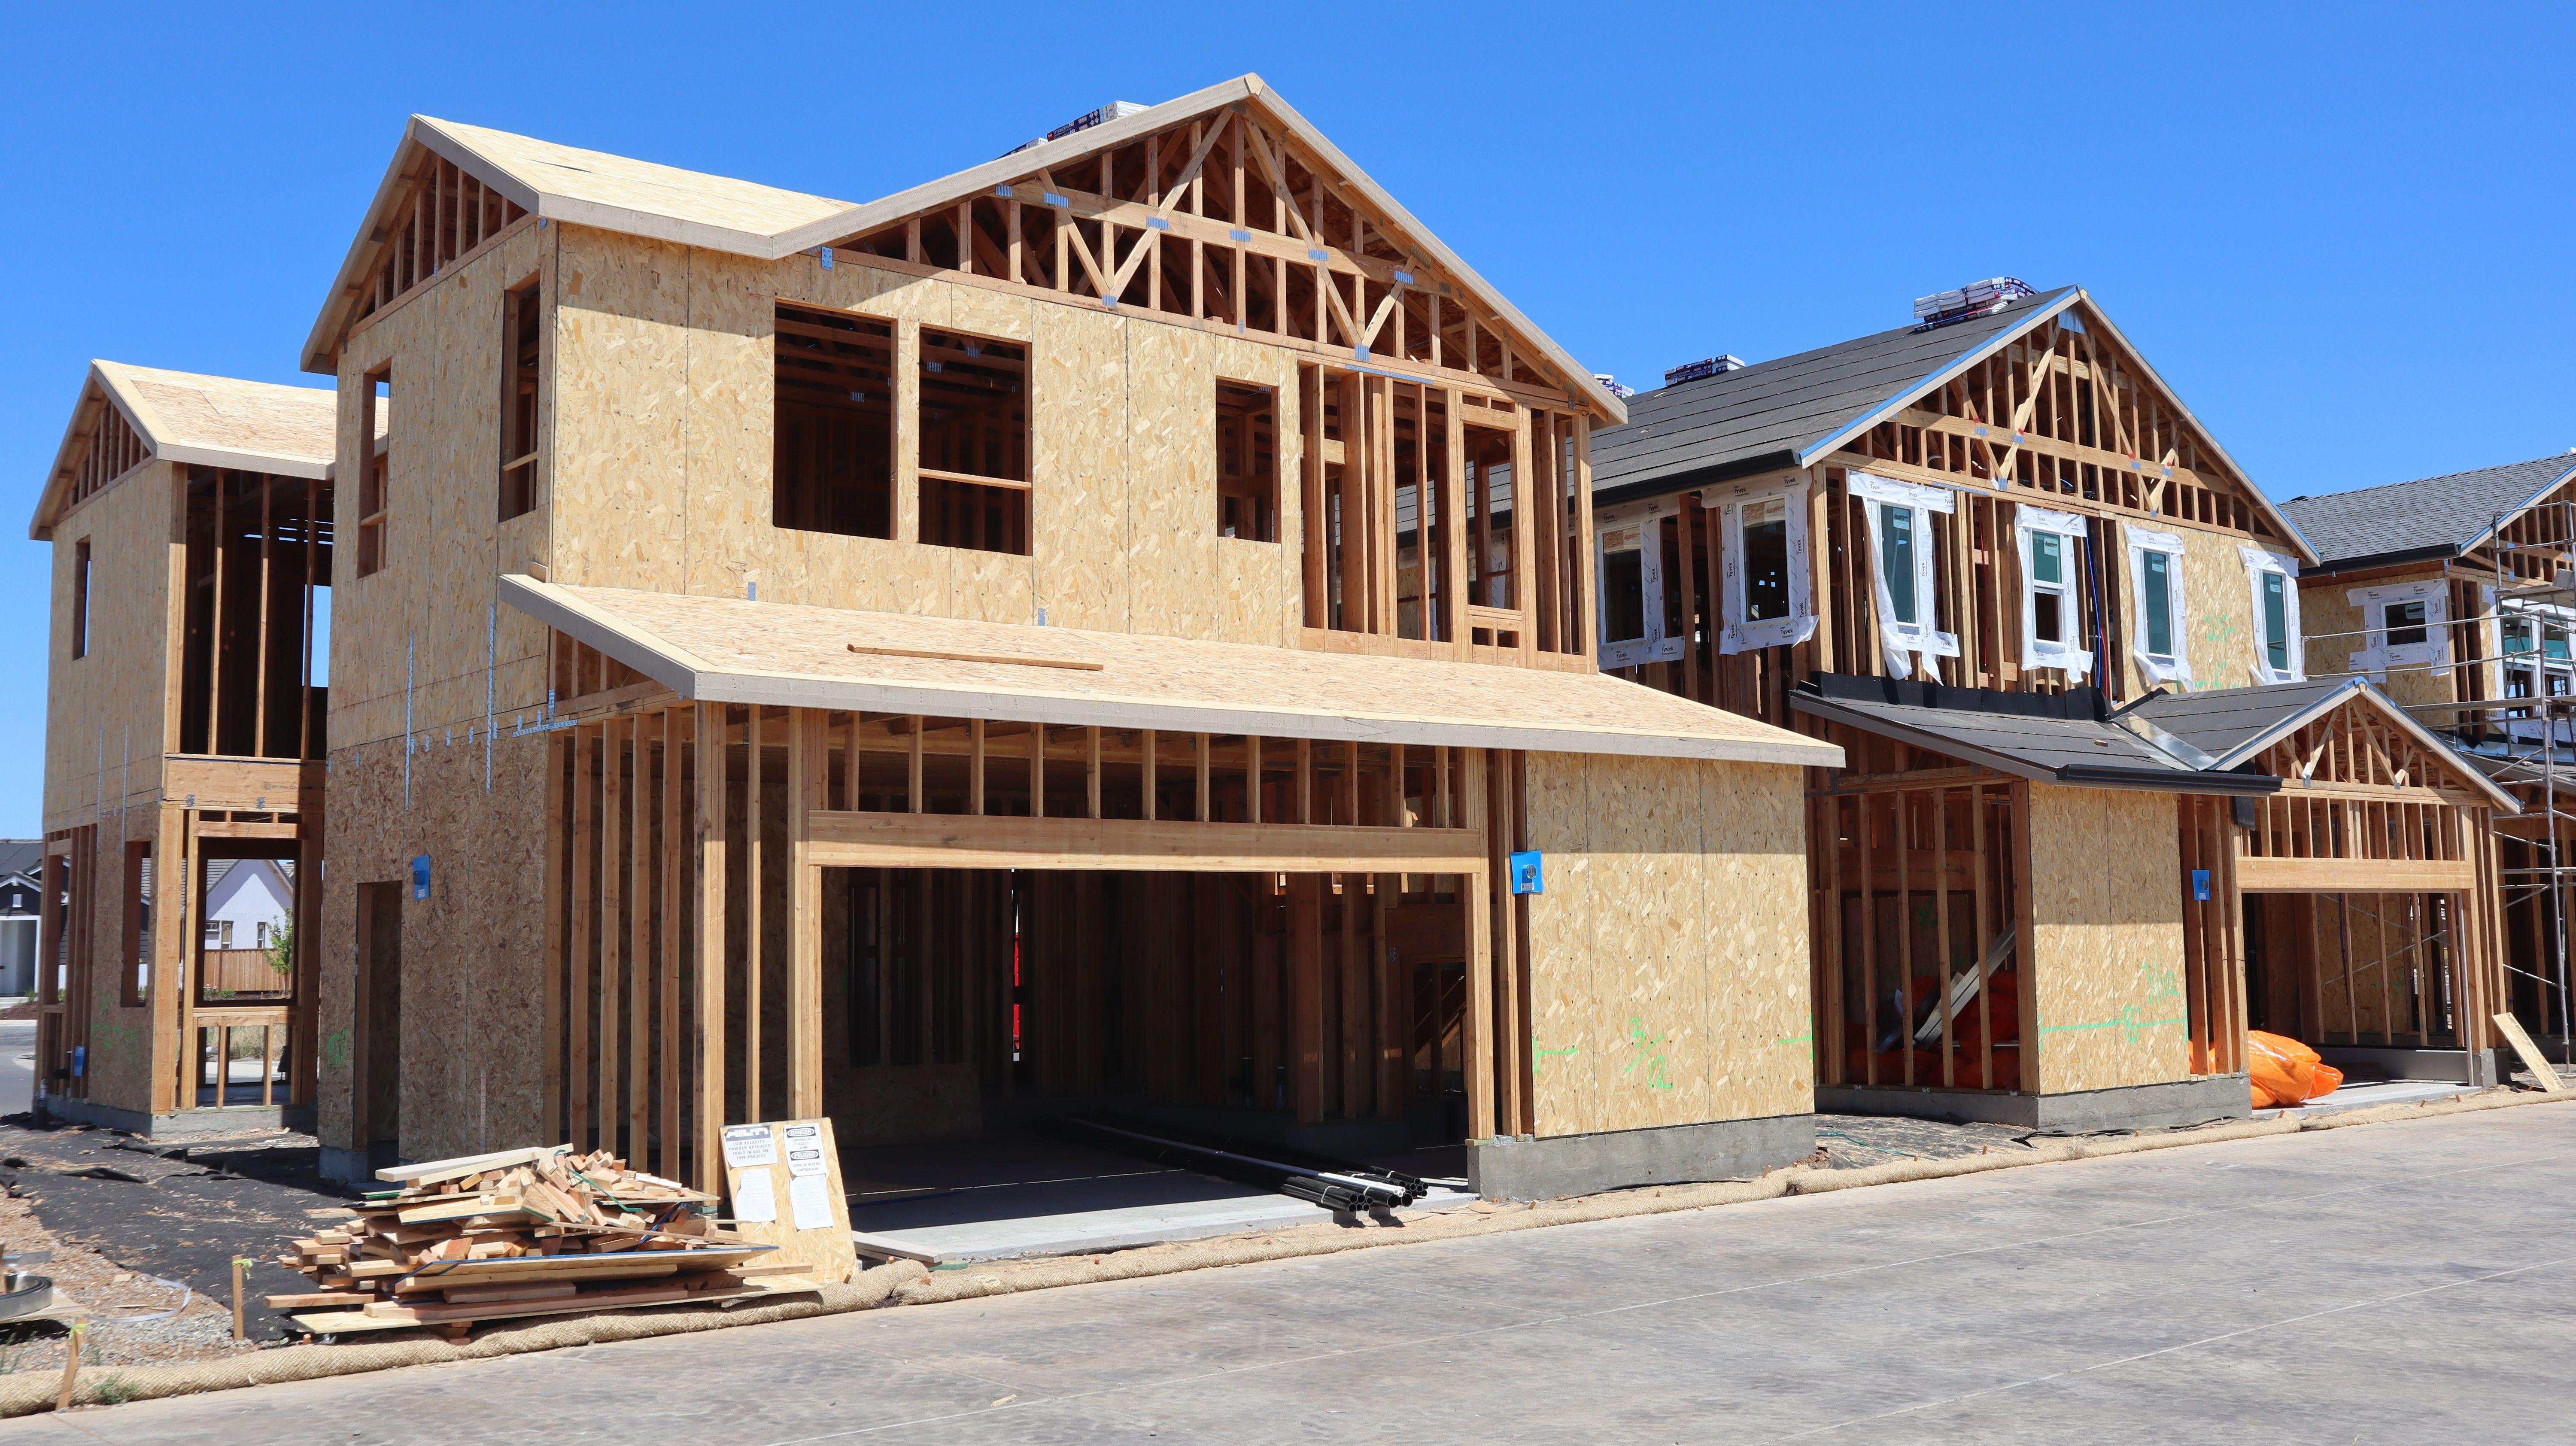






New construction is holding its price advantage over the resale market — and the gap is wide. The national median new-home price was $393,300 in the third quarter of 2026, down 4.2% from $410,700 in the second quarter. The existing-home median was $432,900, down 0.5% from $434,900. That difference of nearly $40,000 kept new homes more affordable relative to existing ones, according to the latest National Association of Home Builders/Wells Fargo Cost of Housing Index.
The index measures the share of income a family needs to make a mortgage payment on a median-priced home. A family earning the national median income of $106,800 needed 33% of its income for a new home, down from 34% in the second quarter. For an existing home, that share was 36%. Low-income families, defined as those earning 50% of the median income, needed 66% for a new home, down from 67%, and 73% for an existing one.
Local conditions vary widely. The index also tracks 175 metro areas, where it measures the cost of a median-priced existing home. Eight markets are severely cost-burdened, with families spending more than 50% of their income, led by San Jose-Sunnyvale-Santa Clara, Calif. (79%), Urban Honolulu (73%) and San Diego-Chula Vista-Carlsbad, Calif. (70%). Another 87 are cost-burdened at 31% to 50%, and 80 are at 30% or lower. Decatur, Ill., ranks lowest at 17%, followed by Elmira, N.Y. (18%), and Peoria, Ill. (19%).