Housing Economy

Latest news in the housing economy

  • Bay Area estate is August’s highest home sale

    Bay Area estate is August’s highest home sale

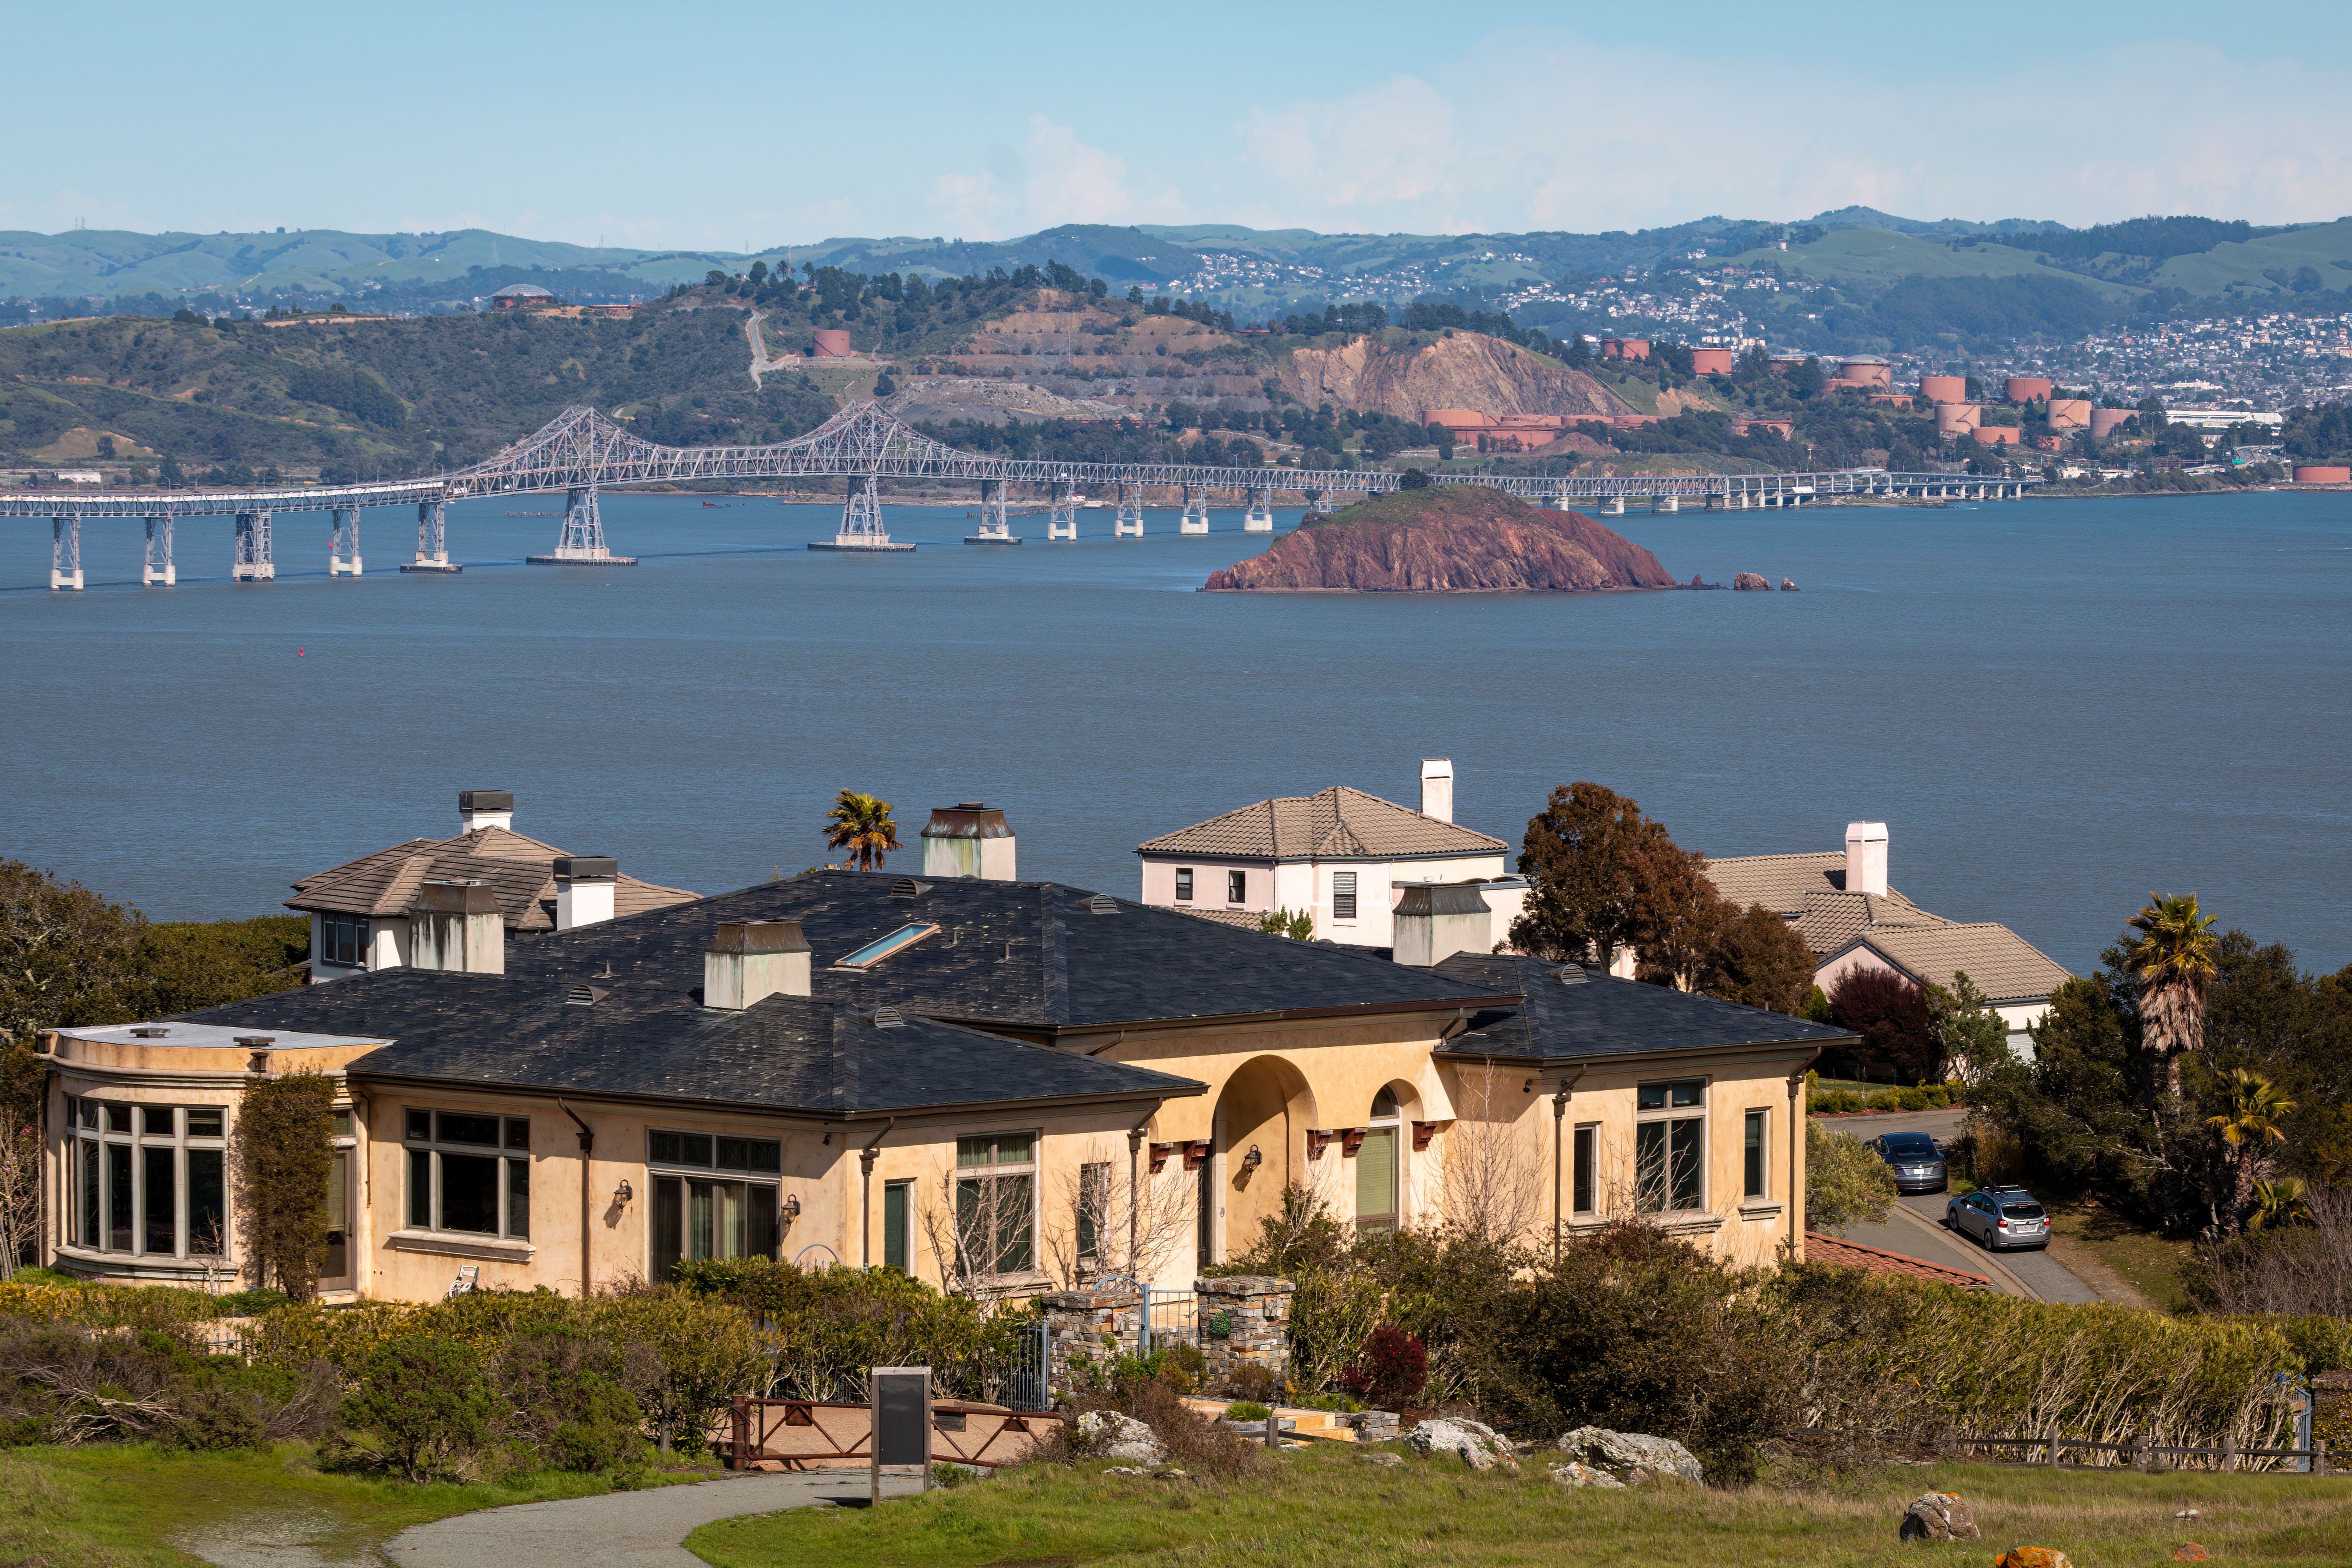
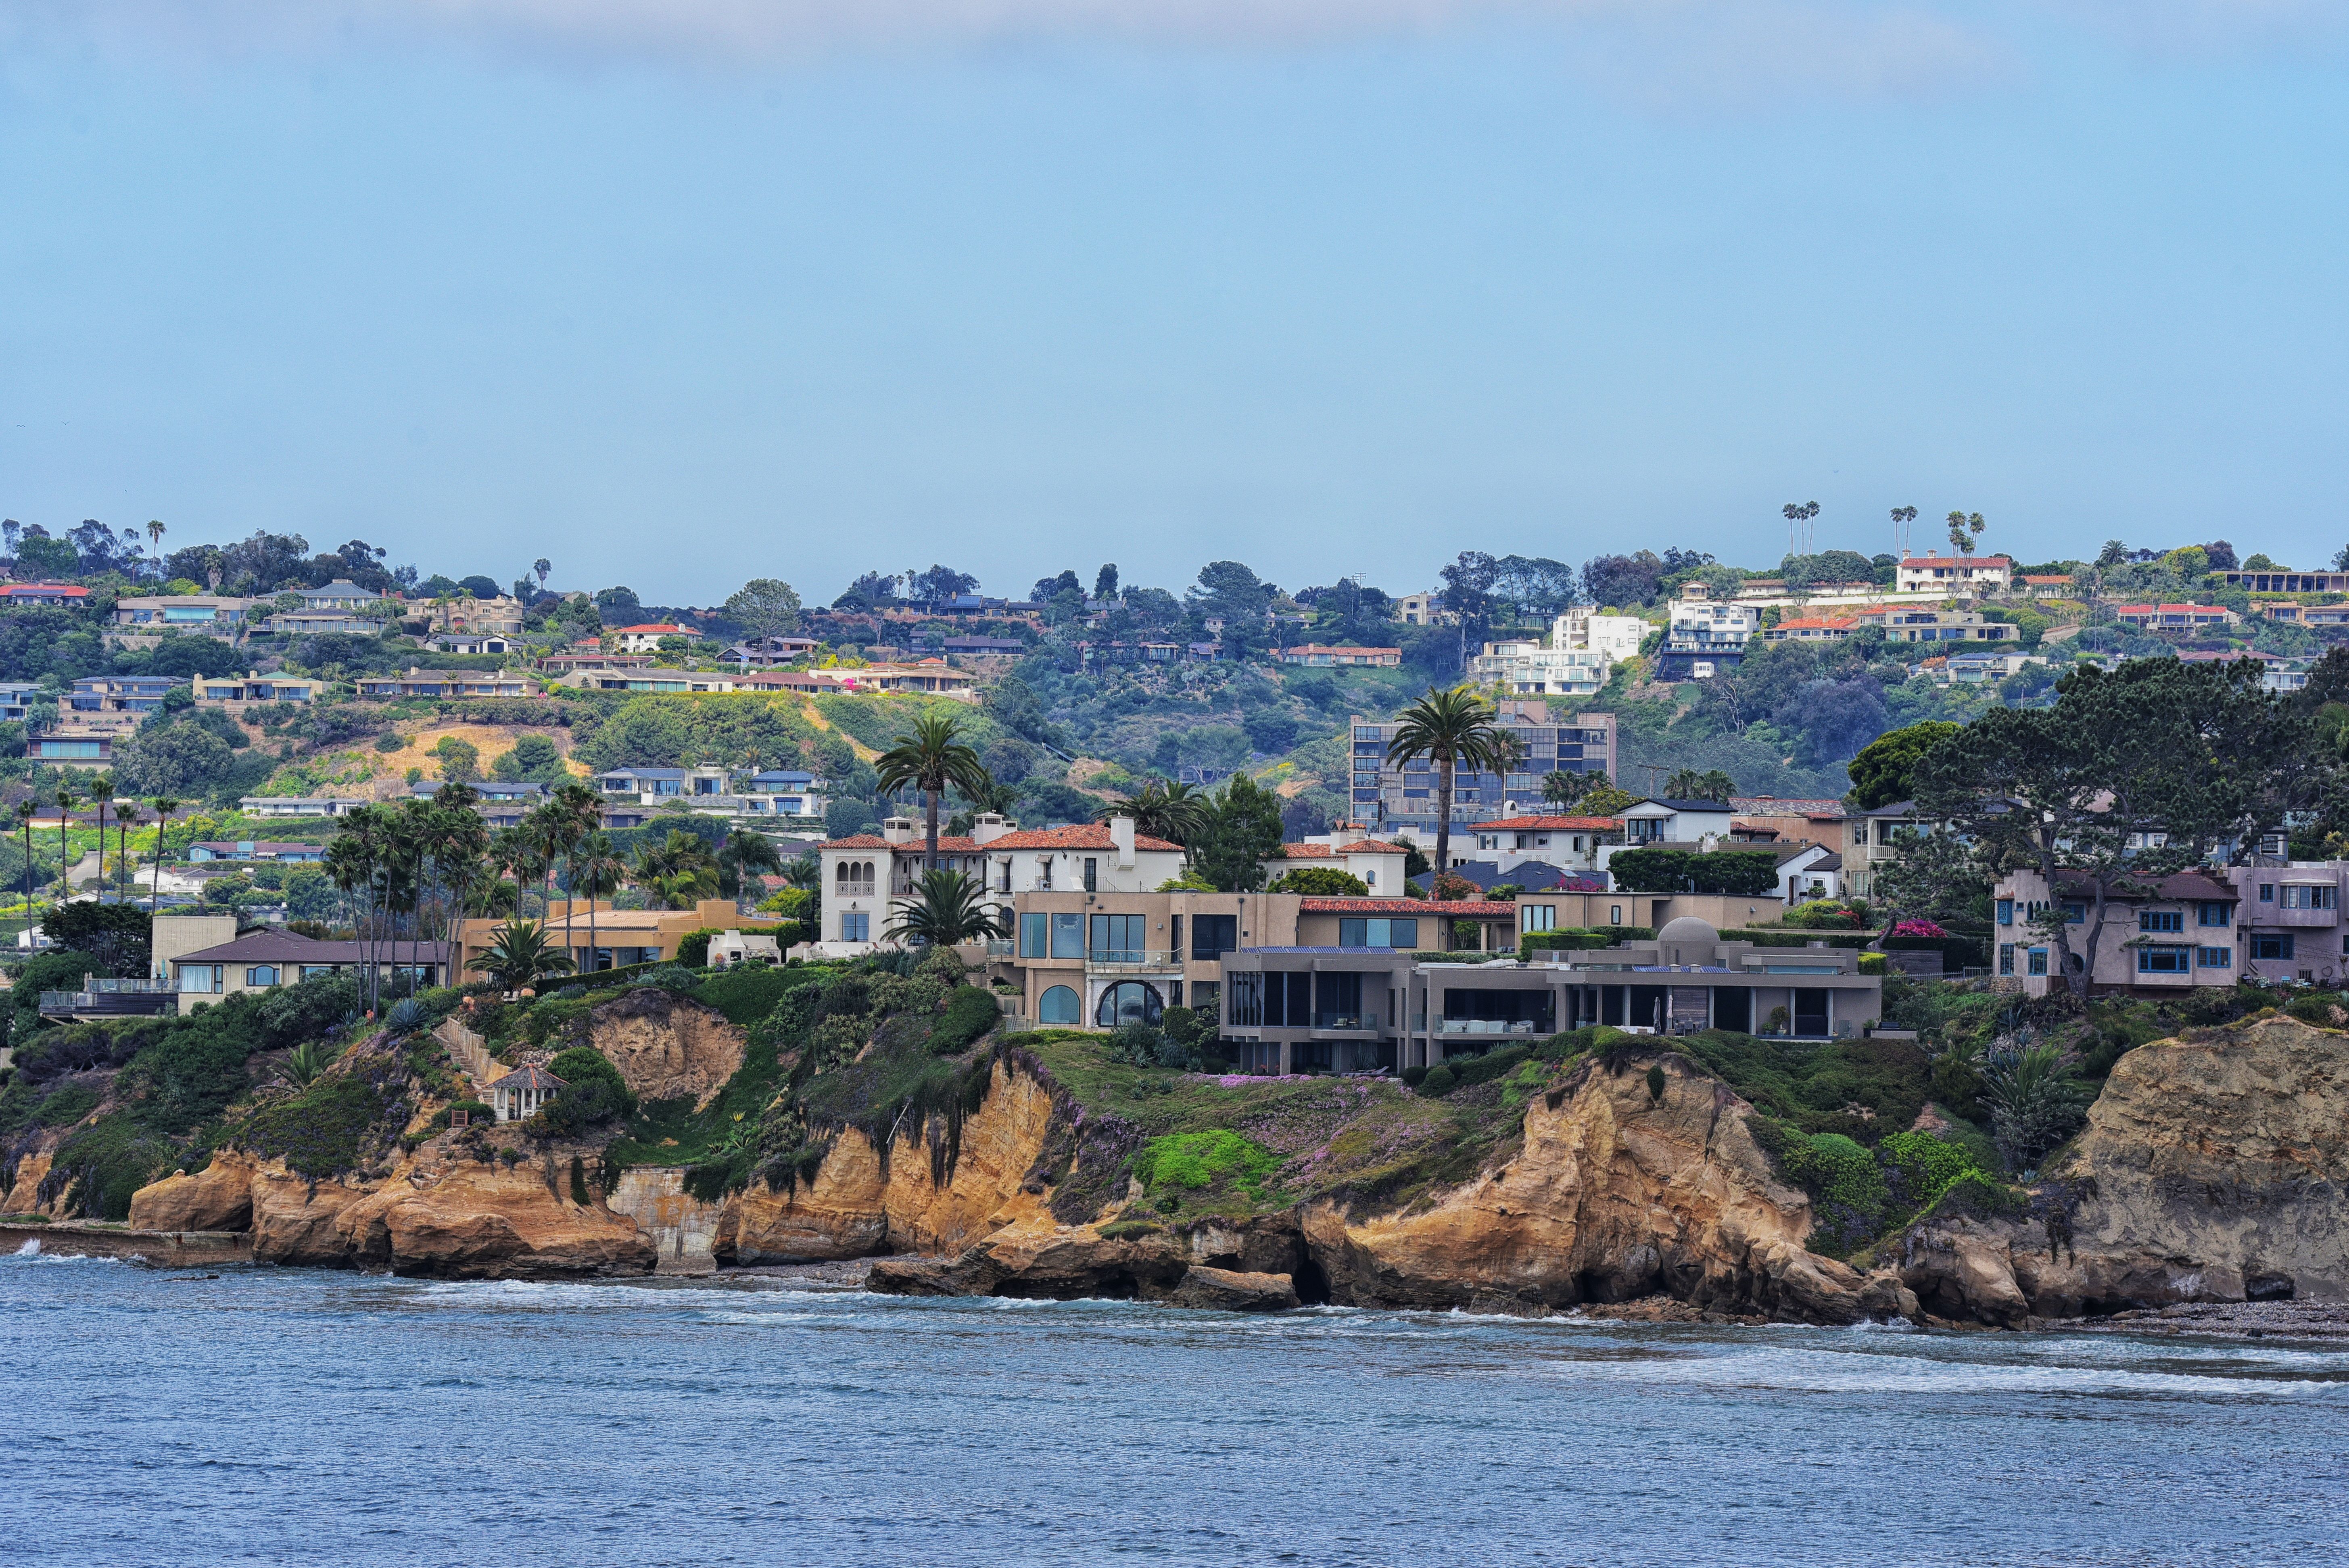
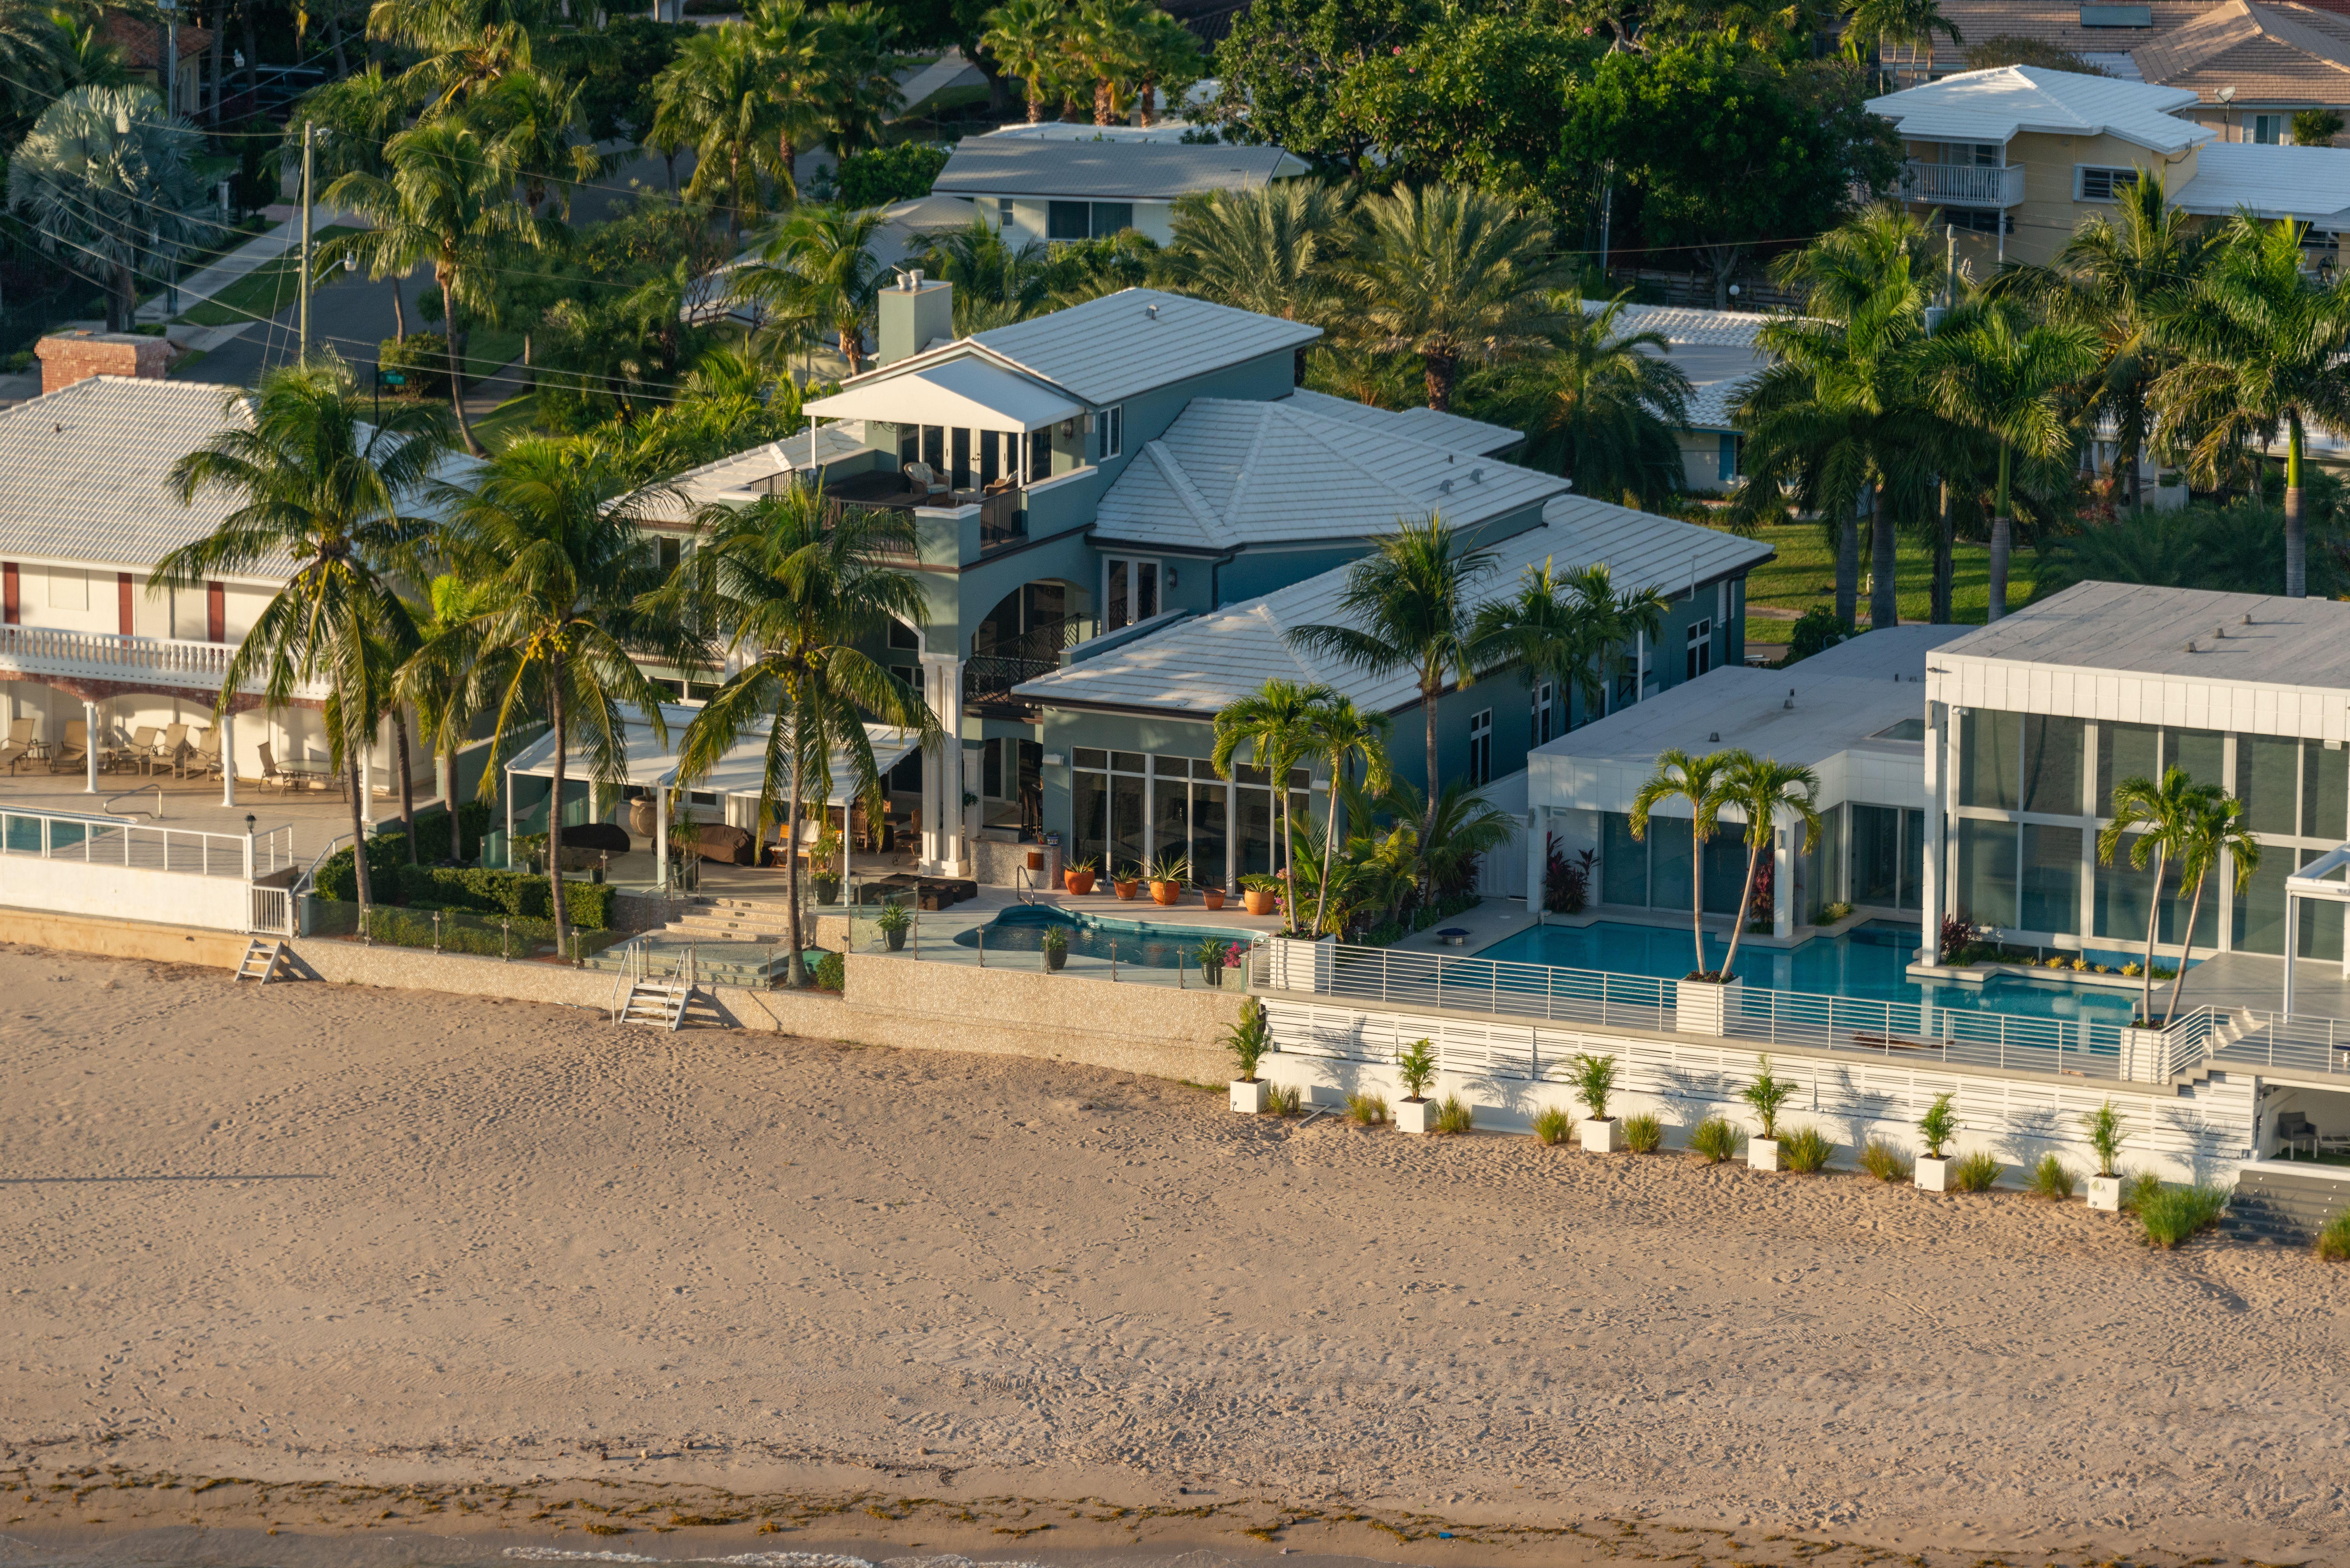
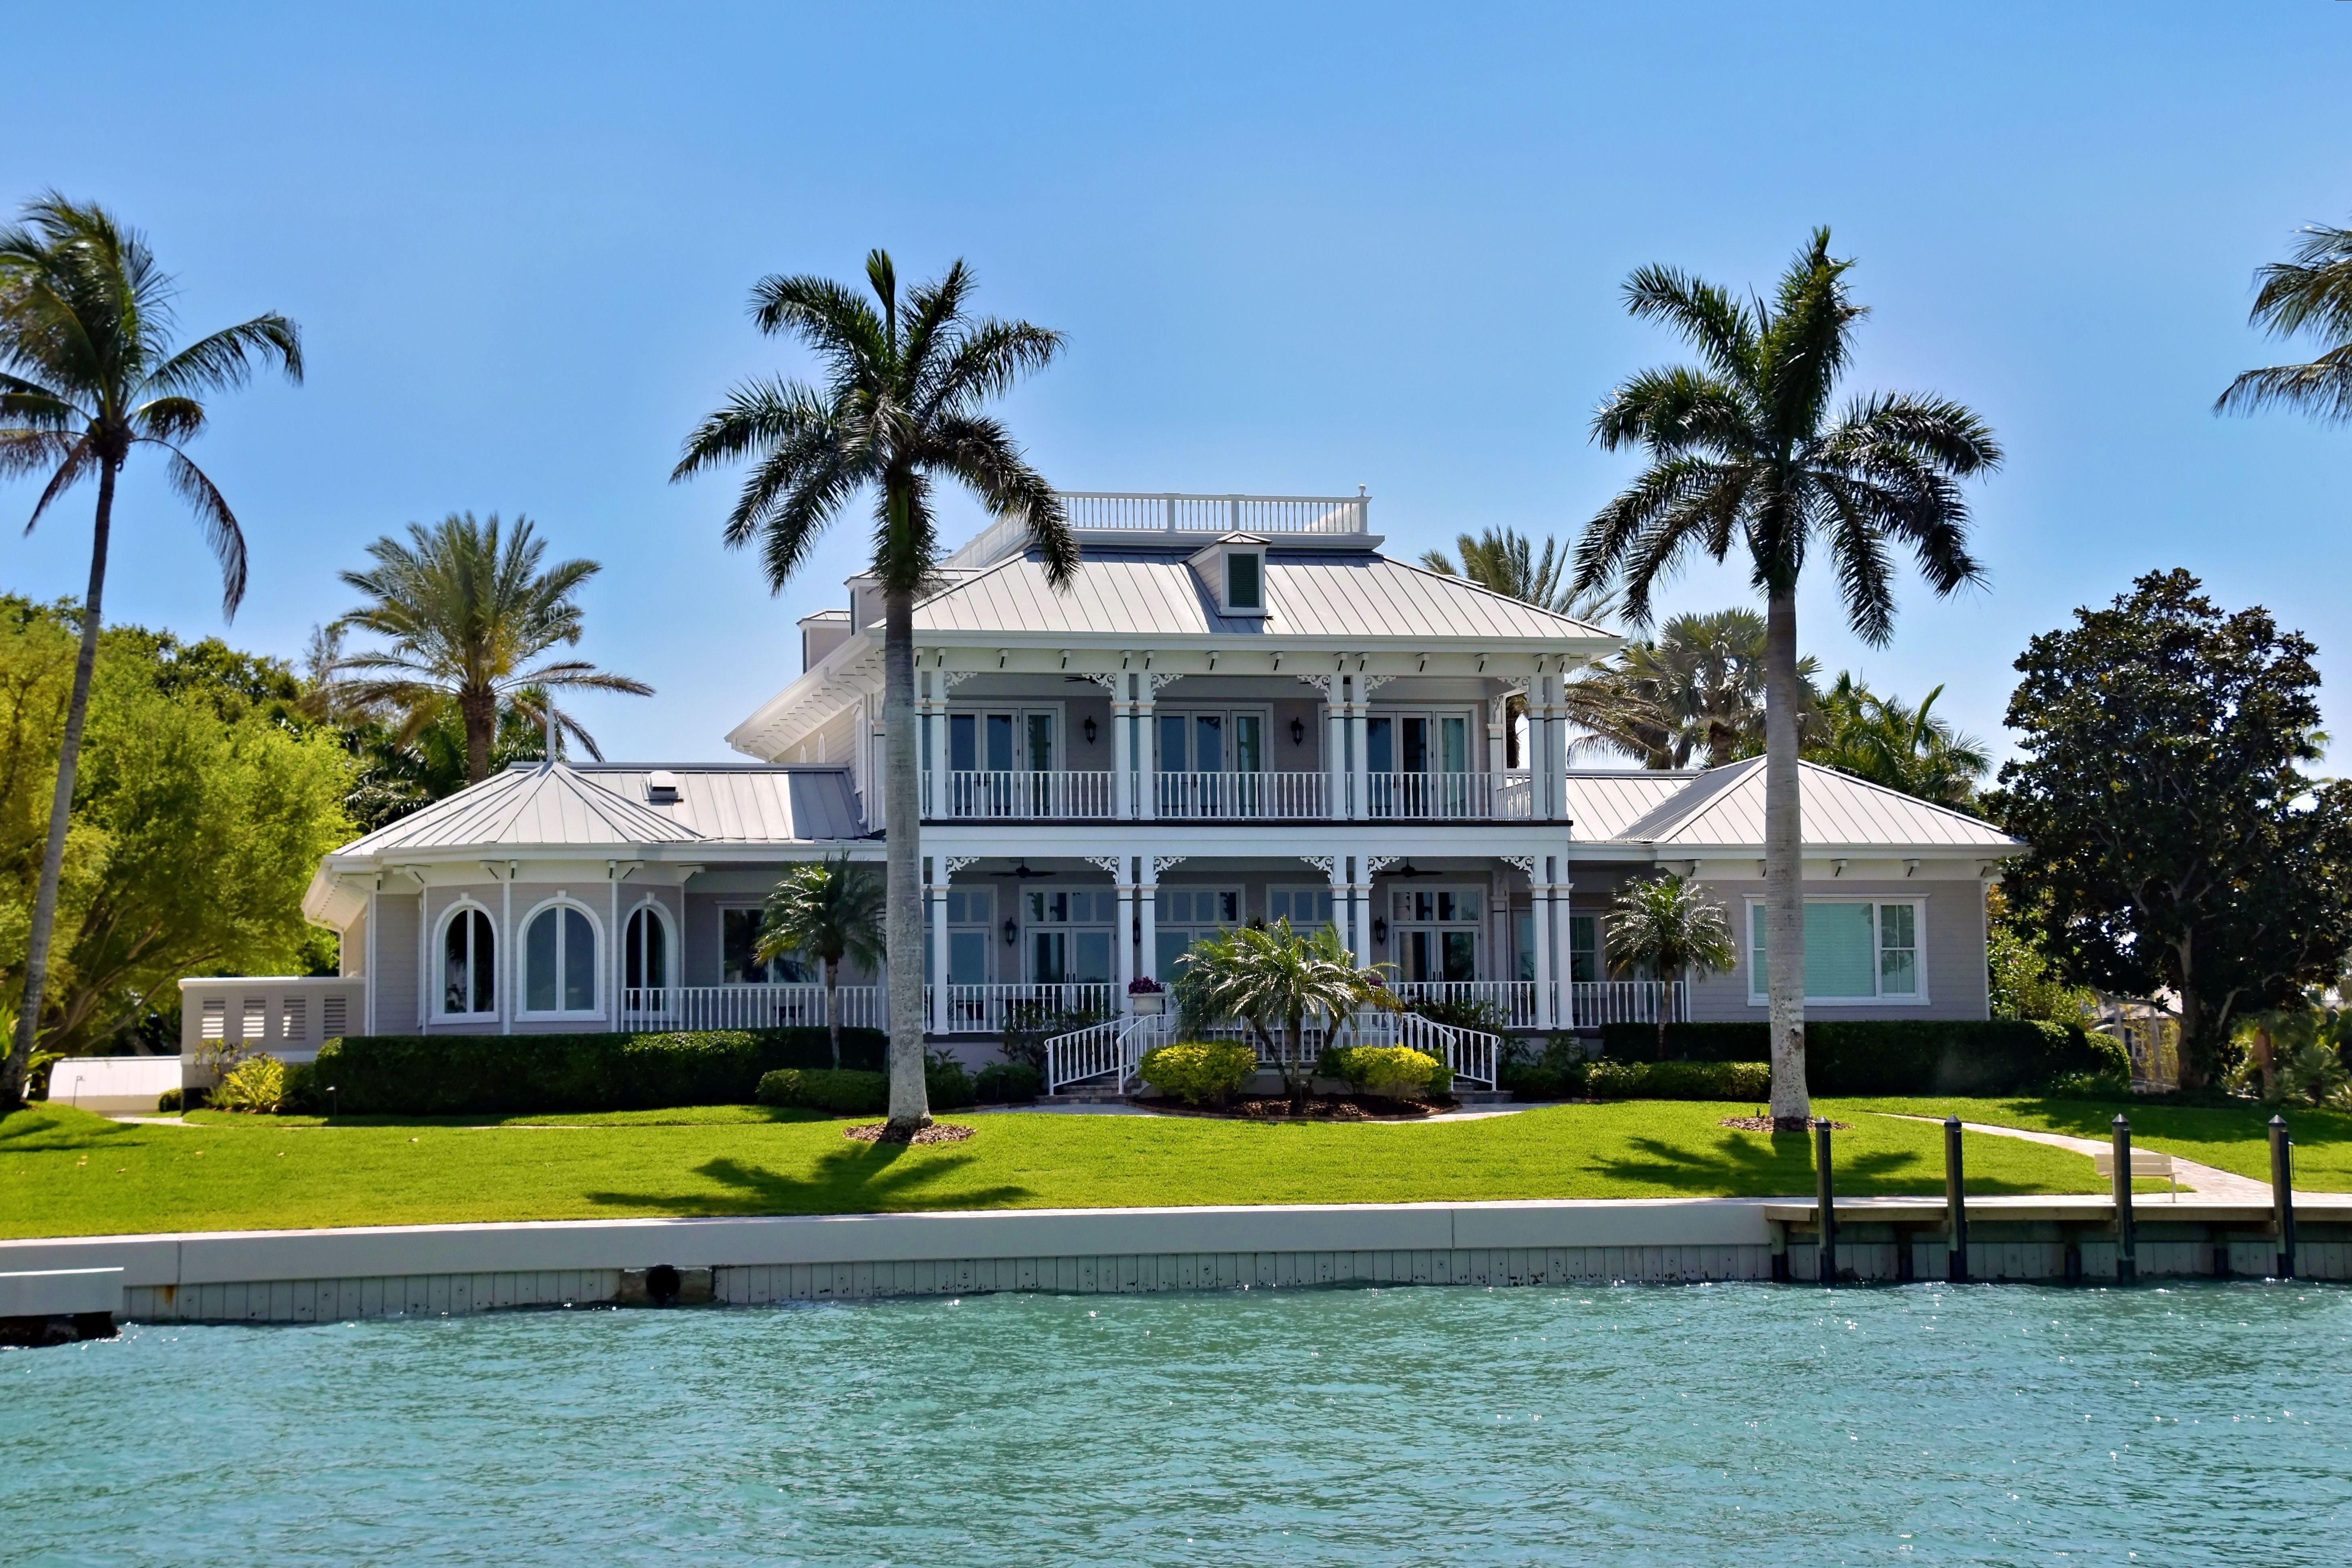
    An estate in Hillsborough, Calif., sold for $70 million and was the highest U.S. home sale in August, followed by a $51.5 million waterfront villa in Miami Beach, Fla. California is home to six of August’s 10 priciest sales, with four in the Bay Area and two in Orange County.

    Three of the most expensive homes sold were in Florida, with each selling at $30 million or more. A beach-compound in Hawaii sold for $38.2 million, earning it fifth place in August’s top 10 most expensive home sales.

    San Francisco’s luxury housing market has been performing well throughout 2026, as AI wealth continues to drive the housing market in the Bay Area.

    Read Full Article

  • Fed raises rates for the first time in 3 years

    Fed raises rates for the first time in 3 years

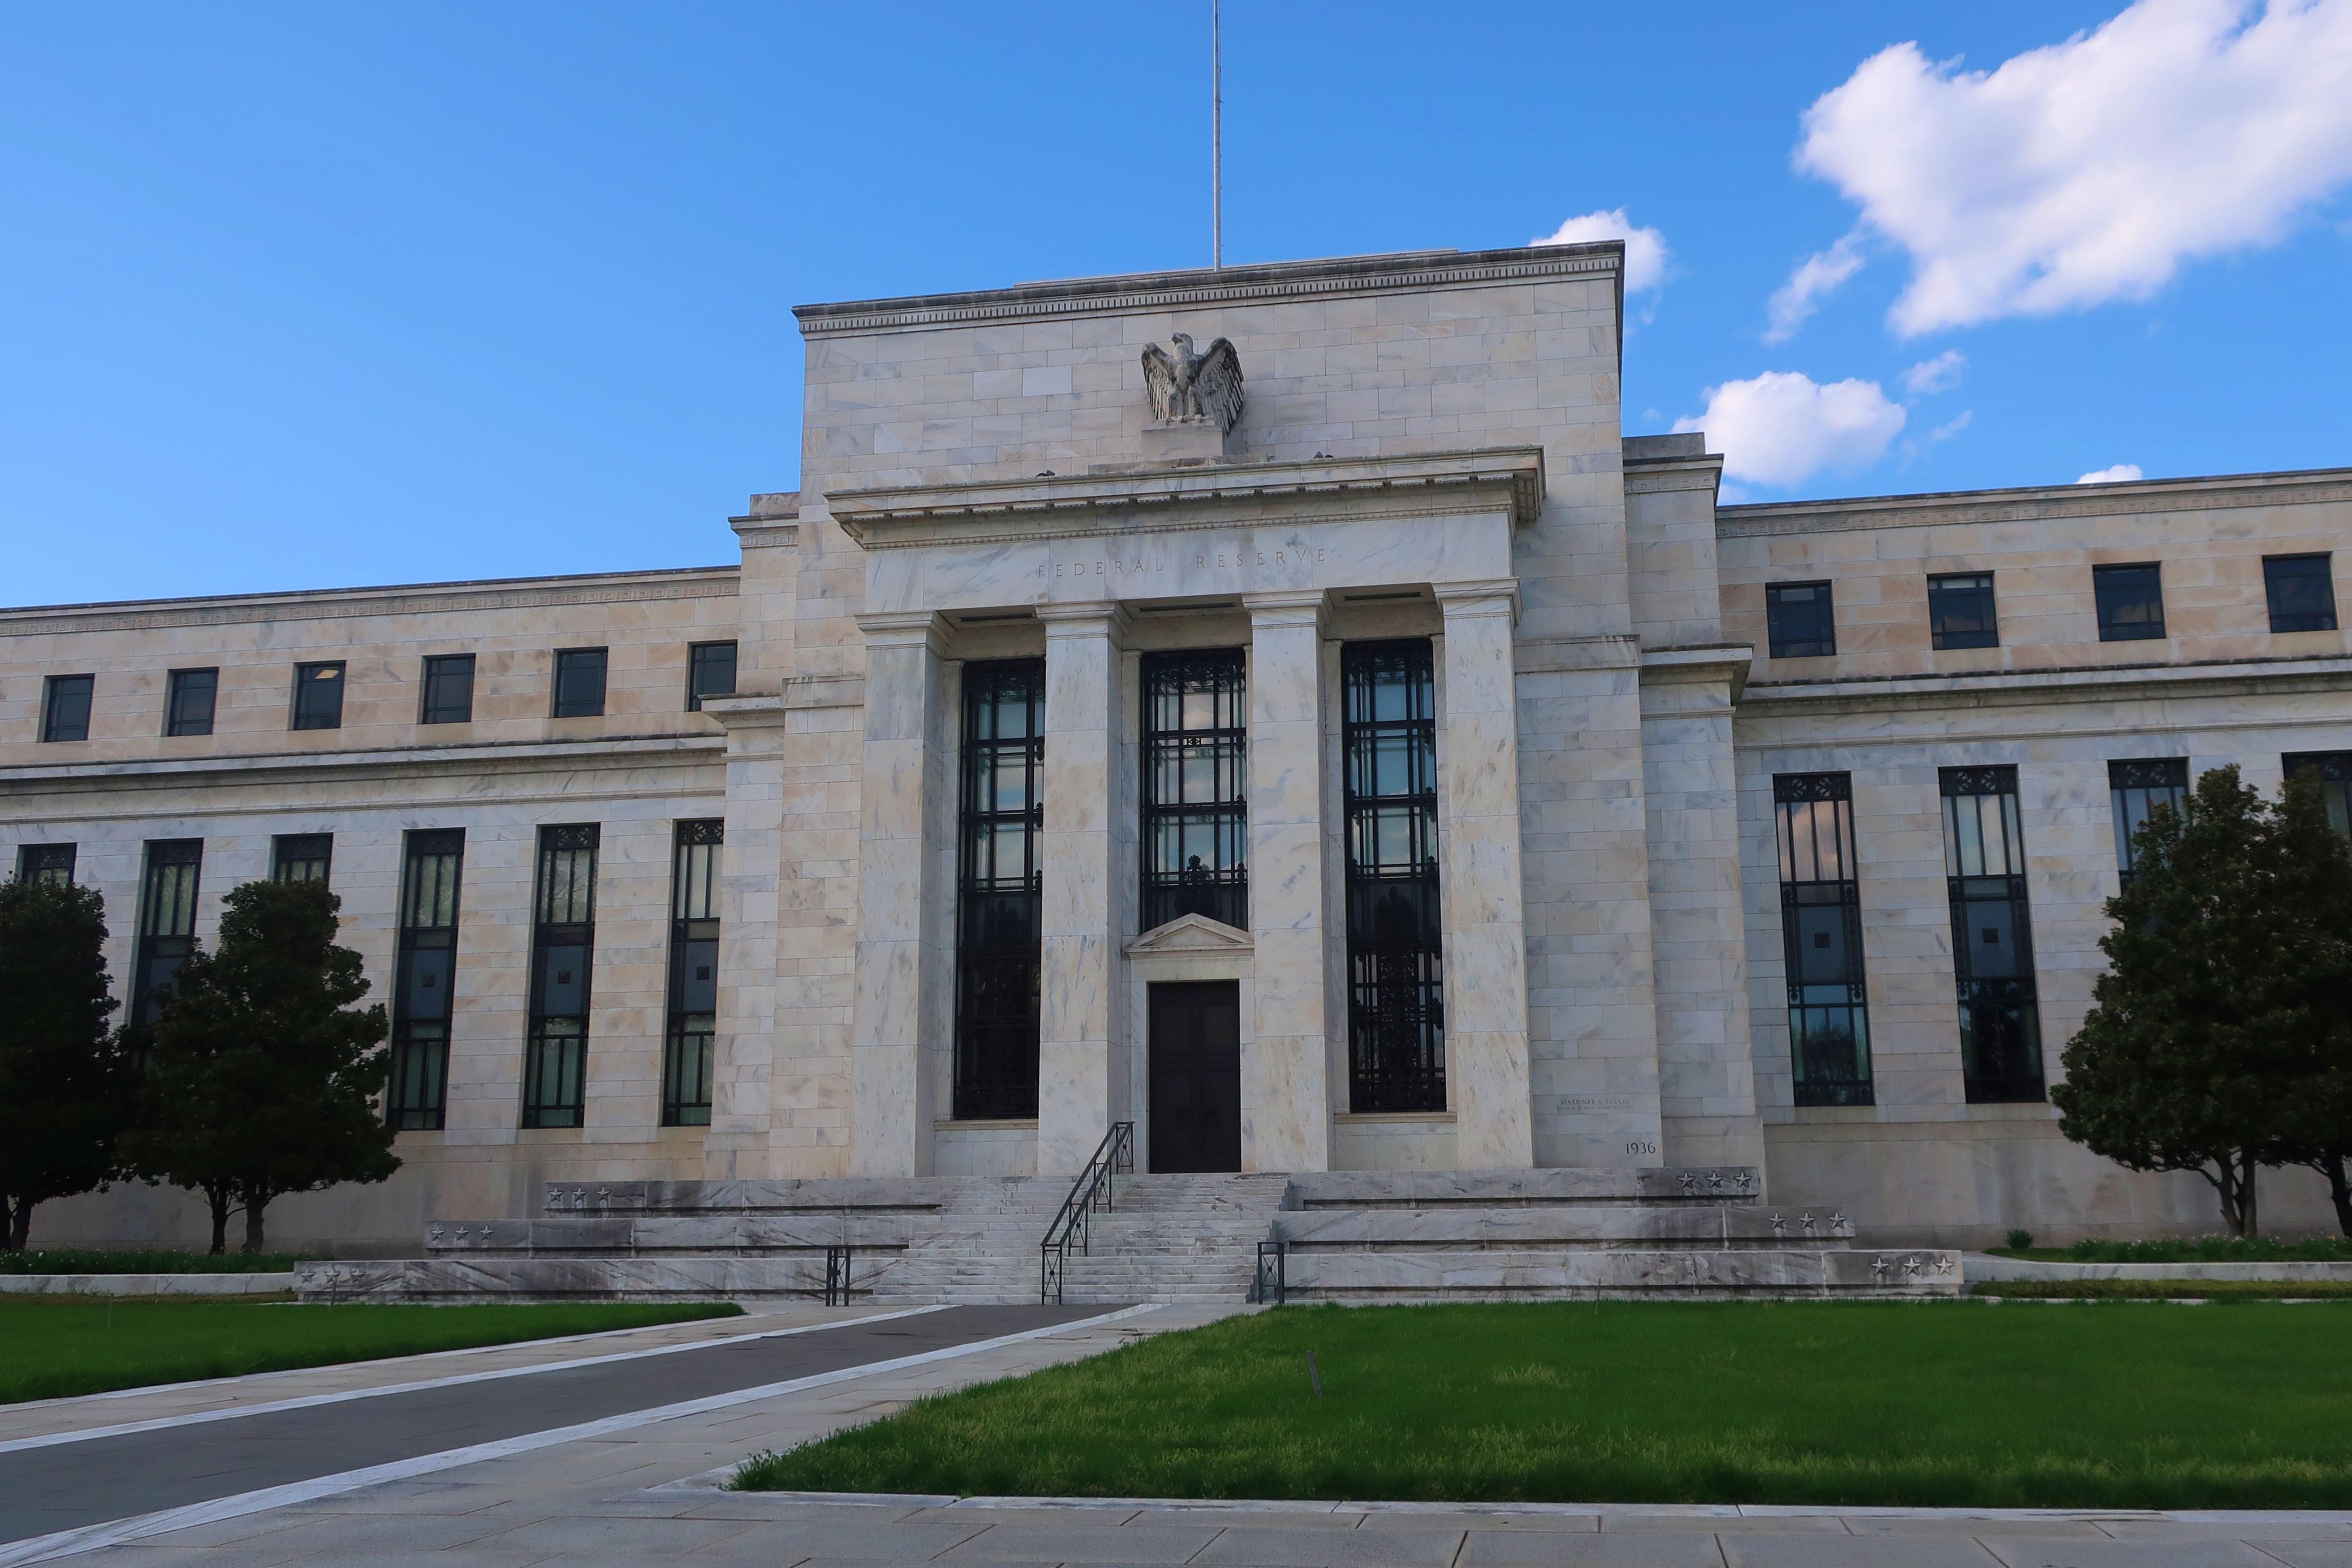
    On Sept. 16, 2026, the Federal Reserve increased its benchmark interest rate target range by 25 basis points to 3.75%–4.00%.

    This bump is not a shock, as many economists predicted the Fed would increase rates to combat rising inflation. However, this is the first rate hike since July 26, 2023.

    The unanimous decision to raise rates is the first real movement in nearly a year, holding steady throughout 2026 after the last cut in December 2025.

    Federal Reserve Chairman Kevin Warsh described this decision in the post-decision press conference as a step to deliver a timelier return to the Fed’s 2% inflation goal.

    Warsh also noted that despite the geopolitical landscape of shock and uncertainty, the FOMC remains optimistic for economic returns.

    However, there is a question of whether short-term rate hikes address the core drivers of inflation.

    “While a 25 bps rate hike would reinforce the Fed’s commitment to price stability and help address credibility concerns, it is less clear that higher short-term rates can meaningfully reduce inflation driven by supply constraints and capital-intensive investment trends,” said Selma Hepp, PhD, Cotality Chief Economist and Builder and Developer contributor. “The bigger question is whether the Fed risks fighting the wrong inflation battle.”

    “With the Fed hiking rates for the first time since 2023 on a unanimous 12–0 vote, even its own economists think inflation gets worse before it gets better,” said Patrick Duffy, Principal, MetroIntelligence and Builder and Developer contributor.

    Impact on the Residential Construction Industry

    For homebuilders, the decision could reinforce constraints on both housing production and the buyer market.

    The September National Association of Home Builders (NAHB)/Wells Fargo Housing Market Index (HMI) reported that builder confidence is down to 32, with mortgage application volume falling 3.2% in August.

    “Today’s rate hike will have a limited effect on mortgage rates, but it will increase the cost of financing for builder and land developer loans, which are more directly connected to short-term interest rates including the funds rate,” said Robert Dietz, PhD, NAHB Chief Economist and Senior Vice President for Economics and Housing Policy. “This will increase construction costs and add to housing affordability challenges.”

    “A rate hike is unlikely to lower gasoline prices, reduce tariff-related costs, or accelerate homebuilding, but it would further dampen housing demand and delay a broader market recovery,” added Hepp. “For the housing market, the key challenge is that mortgage rates remain highly sensitive to Fed communication, even though they are increasingly driven by long-term Treasury yields rather than the federal funds rate itself.”

    Throughout the year, volume builders have combated buyer affordability concerns with price cuts, incentives and rate buydowns.

    “For the housing market already facing slower sales, this is a “higher for longer” signal, which benefits those builders who can offer mortgage rate buydowns while still retaining positive profit margins,” Duffy suggested. “If there is a silver lining, it’s that a stronger job market supports housing demand even as borrowing costs stay elevated.”


  • A tale of two cities and their housing markets

    A tale of two cities and their housing markets

    According to a new analysis from Redfin, San Francisco and Seattle are two of the nation’s leading technology hubs. However, the cities are currently at opposite ends of the housing market. San Francisco’s housing market continues to boom, while Seattle’s is beginning to cool.

    San Francisco’s median home-sale price jumped 6% year over year in July 2026 to $1.6 million, making it the priciest metro area in the United States. Meanwhile, Seattle’s median sale price declined 4% to $809,000, approximately half the price of San Francisco’s typical home. Seattle’s home price decline was the second-biggest among the 50 most populous U.S. metros.

    The two cities tell a very different story in their home sales. In San Francisco, home sales rose 9% from 2025, the second-biggest uptick in the country. In Seattle, home sales fell 9%, the fifth-biggest decline in the nation.

    Read Full Article


  • Texas housing market strengthens in first half of 2026

    Texas housing market strengthens in first half of 2026

    Texas housing market activity strengthened through the first half of 2026, with closed sales outpacing last year’s levels. This suggests that underlying housing demand remains resilient despite ongoing economic headwinds and persistent affordability constraints. Sales gains have been consistent statewide, suggesting that buyers are adapting to current mortgage rates while benefiting from more stable inventory conditions and greater choice.

    Pricing trends also point to a gradually improving market environment in Texas. While home prices remain below year-ago levels, the pace of decline has continued to ease.

    As the peak home buying season comes to a close, continued improvement in inflation readings should help support market stability by reducing the likelihood of a policy rate increase.

    Read Full Article

  • Slump continues in July AIA/Deltek Architecture Billings Index

    Slump continues in July AIA/Deltek Architecture Billings Index

    The American Institute of Architects (AIA) recently released the AIA/Deltek Architecture Billings Index® (ABI) for July. The score is 46.6, a dip from June.

    Important to note, it reports on all architectural billings, not residential alone. Multifamily residential received a stronger score than overall at 48.4.

    AIA announced that the slump in billings is the longest in the ABI’s history, now surpassing three and a half years.

    “Macroeconomic uncertainty continues to weigh on the built environment,” said AIA Chief Economist Richard Branch. “High oil prices are putting upward pressure on inflation and may lead to even higher rates in the back half of the year. This will put additional pressure on developers and may lead to a further weakening in billings.”

    Read Full Article 

  • California scores most expensive mid-year home sale

    California scores most expensive mid-year home sale

    The most expensive U.S. home sale of July came from a Bel Air estate in California, known as Casa Encantada. The luxury home sold for $130 million, making it the second-most expensive home sale of 2026 so far.

    The other three top sales also came from Southern California: a beachfront Malibu mansion, an architectural gem in Orange County and a Beverly Hills compound. The most expensive mid-summer sales also include two townhouses in Manhattan, New York, and three oceanfront Florida estates.

    All 10 of July’s most expensive homes sold for at least $40 million.

    Luxury and custom homes continue to provide light in the midst of a struggling housing market.

    Read Full Article

  • Rising home prices impact summer sales

    Rising home prices impact summer sales

    Due to higher mortgage rates and home prices, summer home sales have been more moderate this year. Home sales, including single-family homes, townhomes, condos and co-ops, fell 1.7% in July 2026 compared to June. However, sales reached a 0.7% increase compared to a year ago. Lawrence Yun, the National Association of REALTORS’ (NAR) chief economist, said that the year is still showing signs of improvement.

    “Home sales have been remarkably stable, even amid the rising mortgage rate environment of the past few months,” said Yun.

    NAR recently reported that 80% of about 235 major metro areas it tracked continued to see home prices rise in the second quarter. Some metros even reported double-digit annual price increases of about 10%.

    “Sellers are making more price adjustments as summer progresses, and buyers are responding more selectively, but homes are still going under contract at a faster pace than last year,” said Danielle Hale, Realtor.com’s chief economist. “The key question for the months ahead is whether price reductions help sustain buyer engagement or signal that sellers are getting ahead of softer demand.”

    Read Full Article

  • Mortgage demand moderates in July

    Mortgage demand moderates in July

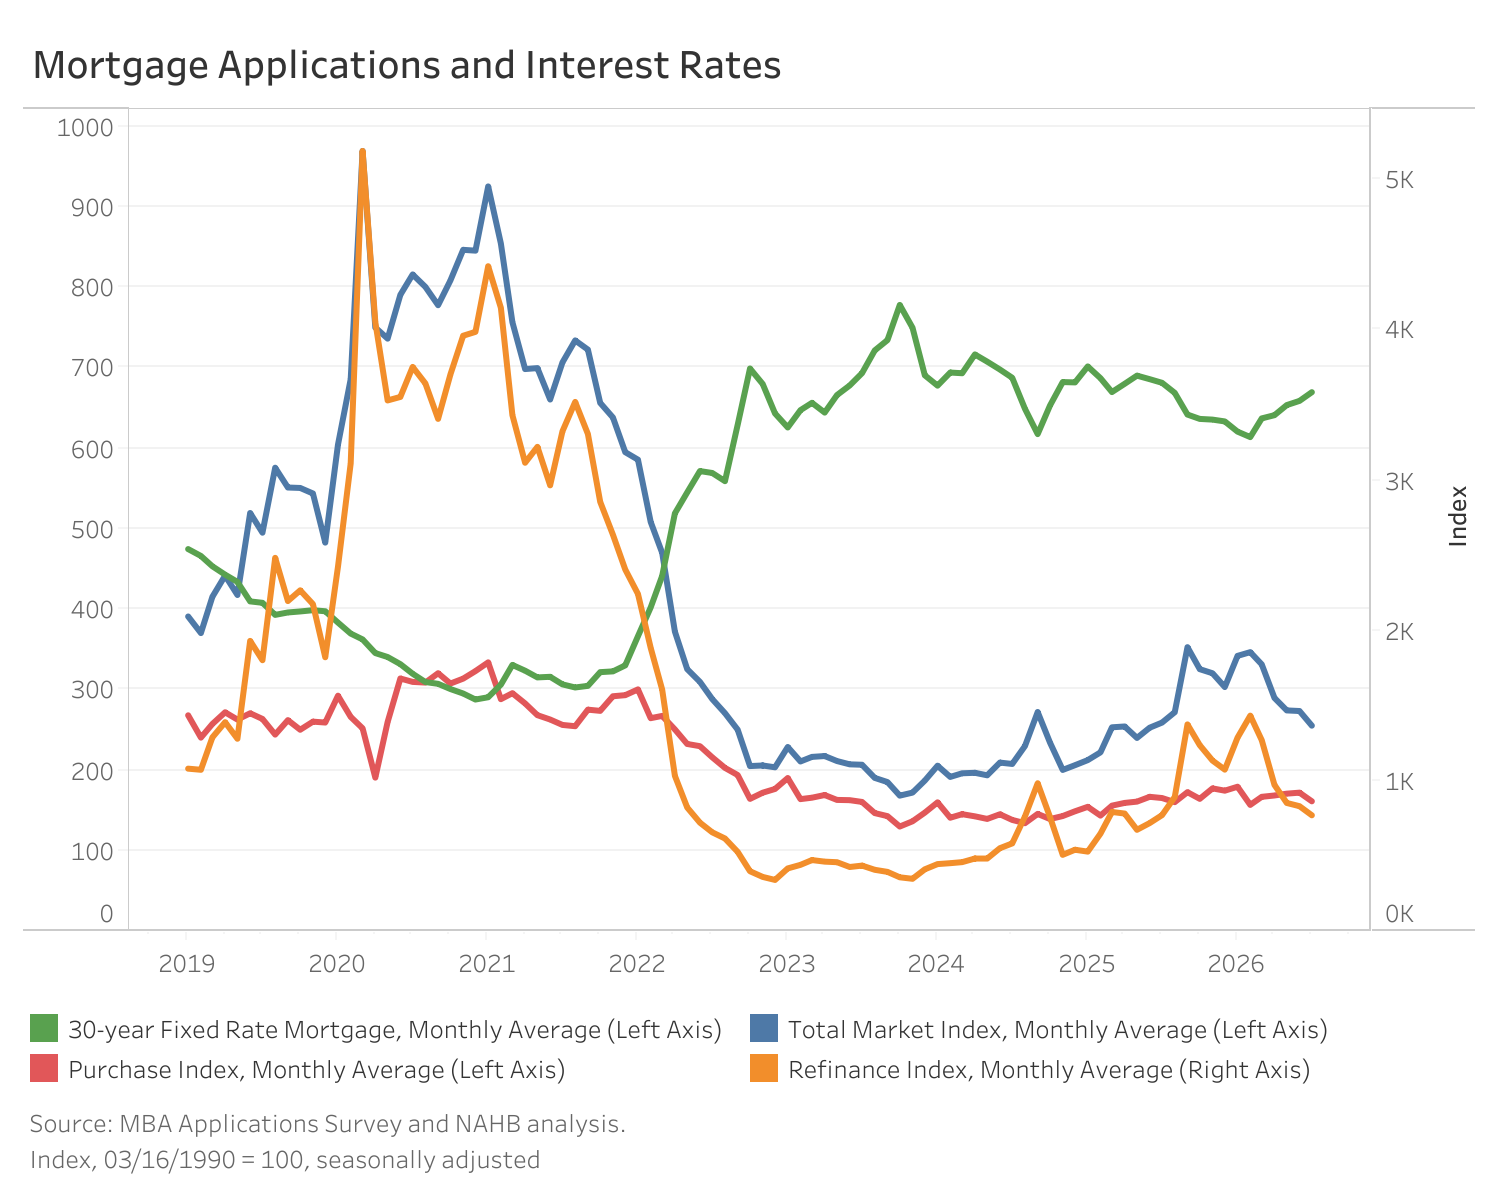
    Recent analysis from the National Association of Home Builders (NAHB) of the Mortgage Bankers Association’s (MBA) Market Composite Index shows that mortgage applications fell across all sectors in July.

    Compared to June, applications decreased 6.6% and dropped 1.5% year-over-year, the first decline in two years.

    With current 30-year fixed-rate mortgage rates at 6.69%, these dips in applications are largely attributed to growing economic pressures on consumers and geopolitical uncertainty with the war in Iran.

    In July, the average loan price also fell across all categories.

    “The overall loan size decreased 2.5% to $383,600,”  wrote NAHB Forecasting and Analysis economist Catherine Koh. “The average purchase loan size fell 2.6% to $444,600, while the average refinance loan size declined 2.2% to $296,000.”

    Read Full Article 

  • Starter-home affordability improves for 8th consecutive month

    Starter-home affordability improves for 8th consecutive month

    According to a new analysis from Redfin, starter-home affordability is improving. The income needed to afford an average U.S. starter home is down 1.5% from a year ago, marking eight straight months of declines as price growth cools. Affordability for entry-level homes is improving more than the overall market; the income needed to buy the typical U.S. home is down just 0.5% because price growth remains stronger at higher price points as affluent buyers remain active.

    “We consider a home affordable if a buyer taking out a mortgage would spend no more than 30% of their income on their monthly housing payment. Starter homes are those in the 5th to 35th percentile for sale prices,” said Redfin in its analysis. “This is based on a Redfin analysis of median home sale prices, prevailing mortgage rates and property-tax payments and assumes a 15% down payment. This report focuses on June 2026, the most recent period for which data is available.”

    The analysis found that the income needed to buy a starter home is declining while earnings are rising. The typical American household earns an estimated $87,599, about $17,000 more than what is needed to buy the median-priced U.S. starter home.

    Read Full Article


  • Federal Reserve holds rates steady for fifth consecutive month

    Federal Reserve holds rates steady for fifth consecutive month

    The Federal Reserve, during its July policy meeting, decided to hold interest rates at 3.5% to 3.75%. This comes amid elevated inflation rates, which were attributed to supply shocks. This is also the Fed’s fifth consecutive hold; the last rate cut was in December 2025.

    “The Committee decided to maintain the target range for the federal funds rate at 3-1/2 to 3-3/4 percent, in support of the Federal Reserve’s dual mandate,” the Board said in a statement. “The Committee is continuing its policy of maintaining ample reserves in the banking system.”

    This is Federal Reserve Chairman Kevin Warsh’s second decision of his tenure since he took the helm in May. The National Association of Home Builders Chief Economist, Robert Dietz, discussed what this means for builders.

    “If you squint a little, this can be seen as a dovish policy message because, while the Fed can affect aggregate demand by tightening monetary policy (as the bond market appears to expect), the central bank cannot effectively address supply shocks with policy,” said Dietz. “While this should not be interpreted as taking rate hikes off the table, it is an accurate statement of current macroeconomic conditions and many analysts’ views that the Fed cannot solve energy price increases due to war or one-off tariff effects with monetary policy.

  • New home sales edge higher

    New home sales edge higher

    According to newly released data from the U.S. Department of Housing and Urban Development and the U.S. Census Bureau, newly built single-family home sales rose 1.6% in June to a seasonally adjusted annual rate of 628,000.

    “New home sales are gaining some momentum at the more affordable range of the market, with homes priced below $300,000 accounting for 23% of June sales, up from 16% a year earlier,” said the National Association of Home Builders (NAHB) Chief Economist Robert Dietz. “However, that price point is generally only achievable in markets with lower development and construction costs, particularly with respect to lower state and local regulatory costs.”

    “The pace of new home sales has remained constrained in recent months by elevated mortgage rates,” said Bill Owens, chairman of the National Association of Home Builders (NAHB) and a home builder and remodeler from Worthington, Ohio. “Builders continue to use incentives to support sales, with NAHB survey data showing that 62% of builders offered some form of incentive in June.”

    Read Full Article

  • New single-family homes shift to smaller lots

    New single-family homes shift to smaller lots

    The long-term trend of building single-family detached homes on smaller lots appears to have stabilized. According to an analysis from the National Association of Home Builders, new single-family detached homes have steadily shifted toward smaller lots as a direct result of builders’ efforts to improve affordability and attract homebuyers.

    According to the latest Survey of Construction, the share of new homes built on smaller lots remained near record highs in 2025, following more than a decade of steadily shrinking lot sizes.

    The share of small lots remained high in 2025, with close to two-thirds of new single-family detached homes sold occupying lots under 9,000 square feet. Moreover, 38% of lots were under 7,000 square feet. These shares are just slightly below the record highs established over the last two years.

    Read Full Article

  • June AIA/Deltek Architecture Billings Index gains three points

    June AIA/Deltek Architecture Billings Index gains three points

    The American Institute of Architects (AIA) recently released the AIA/Deltek Architecture Billings Index® (ABI) for June; the score at 47.3 is a three-point increase from May.

    While the reading increased, a metric below 50 indicates an equal share of firms reporting decreases and increases.

    The South continues its reign as the strongest market with a reading at 49.5, despite a 0.01% decrease from May. The West trails at 45.6 with the Midwest close behind at 45.1. The Northeast dropped from 46.2 in May to 44.9 reading in June.

    “Architecture firms remain mired in one of the longest running downturns in the 30-plus year history of the ABI, which now stretches to 41 months without a majority of firms reporting billings growth,” said AIA Chief Economist, Richard Branch. “The uncertainty over the conflict in Iran along with high interest rates and significant labor shortages will continue to weigh on construction – and architect billings over the next several months.”

    Read Full Article 

  • Florida and California lead in luxury home sales

    Florida and California lead in luxury home sales

    June’s largest home sales were split between the coasts of Florida and Southern California. Luxury home sales strongly led each of the state’s housing markets. The most expensive U.S. home sale of the month, a beachfront estate in Manalapan, Fla., sold for $71 million. The second largest sale was a $47 million compound in Beverly Hills, Calif., followed by two coastal Florida properties that each sold for approximately $43 million: a Palm Beach mansion and a Bal Harbour Home.

    In California, some of the largest sales came from the following luxury properties: a West Hollywood penthouse, a Carpinteria beach house and a Newport Beach estate.

    All 10 of June’s largest home sales sold for more than $30 million.

    Read Full Article

  • Builder confidence remains soft

    Builder confidence remains soft

    According to the National Association of Home Builders/Wells Fargo Housing Market Index (HMI), builder confidence in the market for newly built single-family homes fell two points to 34 in July, down from an upwardly revised reading of 36 in June. Economic uncertainty and persistent affordability challenges driven by rising material prices, high land costs and elevated mortgage rates continue to weigh on the market.

    However, the newly enacted 21st Century ROAD to Housing Act is a positive step that will help expand housing supply and lower overall housing costs. While more policy changes are needed at the state and local levels, the recently passed legislation is expected to boost builder confidence.

    The latest HMI survey also revealed that 37% of builders cut prices in July, up from 35% in June and 32% in May.

    Read Full Article


  • Luxury home prices outpace rest of market

    Luxury home prices outpace rest of market

    Luxury home prices are rising faster than any other market, a recent report from Redfin explains. Year over year, the median U.S. luxury home sale price rose 4.7%.

    It’s a reasonable turn in the sector considering that many high-end homebuyers do not have the same affordability concerns or mortgage rate sensitivities. Therefore, the demand for luxury homes continues to rise.

    Pending sales of luxury homes gained 5.2% year over year, while pending sales for the rest of the market grew 3.6%.

    This is seen side by side in some markets, such as Tampa, where luxury home prices rose 15.6% year over year while all other homes actually saw a decrease of 0.5%.

    The influx of luxury buyers is extremely prominent in one major metro: the Bay Area. Pending sales for luxury homes in San Francisco climbed 45.9% year over year, largely attributed to the AI sector.

    Read Full Article 

  • AIA/Deltek ABI reports decline

    AIA/Deltek ABI reports decline

    The latest AIA/Deltek Architecture Billings Index® (ABI) reported a decrease from its April posting of 48.3, down to 44.5. This is the lowest level since the beginning of 2026. Signaling effects from general economic uncertainty in the past few months, despite cautious optimism earlier in the year.

    The South remains the strongest regional market at 49.6, with the Northeast (46.2), West (45.4) and Midwest (45.3) trailing a bit behind.

    “The uncertainty created by the Iran conflict, and substantially higher energy costs, weighed on architect billings in May,” said AIA Chief Economist, Richard Branch. “Higher interest rates, rapidly rising material costs and continued labor shortages all contributed to softer demand.”

    Read Full Article 

  • Takeaways from the current housing economy

    Takeaways from the current housing economy

    The Harvard Joint Center for Housing Studies released its annual State of the Nation’s Housing report, offering an overview of the current housing market. Many indicators show that housing market activity remained flat in early 2026. New home sales levels remained relatively unchanged, rental retention rates increased and new occupancies declined. Construction saw a slight decrease of 1% over the past year. Key takeaways from the report include subdued activity, weakening demand, and sidelined potential homebuyers.

    The current weakness in housing demand is a direct result of several underlying economic drivers and a decreasing employment growth rate.

    With many U.S. residents burdened by high housing costs, an increasing number of state and local governments are taking action to increase housing production.

    Read Full Article

  • May 2026 Luxury Housing Market Report

    May 2026 Luxury Housing Market Report

    Luxury home prices across the U.S. reached $1,283,432 in May 2026, despite year-over-year declines continuing at -1.4%. The pace of annual softening has pulled back considerably from the 5%-plus drops seen in early 2025, suggesting an uptick in the national luxury housing market.

    Among tracked luxury metros, Minneapolis and Boise City, Idaho, have fully surpassed their pandemic-era peaks as of February, at 5% and 4.2%, respectively. The composition of the top 10 luxury markets was unchanged from April, with the same 10 appearing in slightly different order.

    Year over year, Naples-Marco Island, Fla., at 4.3%, and Crestview-Fort Walton Beach-Destin, Fla., at 3.2%, were the only markets on the list with positive annual price growth.

    Read Full Article

  • June 2026 Housing Market Forecast

    June 2026 Housing Market Forecast

    The National Association of REALTORS released an analysis forecasting the housing market dynamics in June, including sales, inventory and buying trends. The analysis cited various factors, called seasonality trends, that influence the housing market and compared the current market conditions to previous seasonality trends to predict the June 2026 housing forecast.

    The analysis found that existing-home sales typically rise by 8.2% during the month, reaching their highest level of the year on average. The beginning of the summer marks a distinct shift in the housing market, characterized by the end of the school year for most localities, additional daylight and consistently warm weather. These conditions provide more flexibility for potential buyers to view a wider range of open listings.

    June usually sees an average increase of 0.8% in housing inventory, presenting specific advantages for sellers, including the optimal moving conditions previously mentioned, if they plan to buy and the high prices associated with the season.

    Historically, the average home spends about 30 days on the market in June, representing the fastest turnover in the year, alongside May. The favorable weather conditions drive prospective buyers to spend more time viewing homes, resulting in more frequent offers and decreasing the days spent on the market.

    Read Full Article

  • Less young adults are first-time homebuyers

    Less young adults are first-time homebuyers

    According to a report from First American, young adults are the missing gap in first-time homebuyers. Nearly half of 20-to 24-year-olds still lived with their parents in 2025. Only about 25% of 25-to 29-year-olds owned their homes.

    The reality is that homeownership is arriving later in life for young adults, with the delay often originating at moving out of their childhood homes.

    Young adults are moving through traditional markers of adulthood, such as moving out, work, marriage and children, on a different timeline than previous generations. As those milestones shift, the housing sequence that often follows,  moving out, renting and buying, also shifts.

    Most young adults are still renting. While today’s renters are likely to become tomorrow’s buyer, that “tomorrow” is happening later in life. The reasons for this vary between affordability challenges, as well as other life milestones that have shifted into the later years, such as school, work or family.

    Read Full Article


  • Home buying demand ticks up

    Home buying demand ticks up

    The housing market is showing signs of life; contract cancellations decreased in April 2026, indicating an uptick in homebuyers’ demand. Home-sale agreements were only down by -0.1 percentage points from March on a seasonally adjusted basis. This is tied with January for the lowest level of contract cancellations since September 2024, though the level has varied by less than half a percentage point over the last year and a half.

    Contract cancellations inched down this spring as homebuyers and sellers gained a clearer sense of housing-market conditions after several years of volatility. Additionally, the average 30-year fixed mortgage rate declined for three straight weeks in April, giving some buyers confidence in locking in a rate.

    Read More

  • Price drops become less common as market stabilizes

    Price drops become less common as market stabilizes

    According to a new analysis from Redfin, price cuts were slightly less common in April 2026, as the housing market showed signs of stabilization and rising homebuyer demand. More than 35.4% of U.S. home sellers cut their asking price in April 2026, down slightly from 35.6% a month earlier on a seasonally adjusted basis. This is significantly down from a record high of 36.6% in August 2025.

    The decreasing commonality of price cuts is helping sellers regain some negotiating power. Buyers are slowly returning as the job market improves, becoming a bit more confident in their earnings. While buyers are still outnumbered by sellers, they are slightly less so than before, indicating a shift towards a balanced housing market.

    Read Full Article

  • Mortgage rates average 6.51%

    Mortgage rates average 6.51%

    On May 21, 2026, Freddie Mac released the results of its Primary Mortgage Market Survey, showing the 30-year fixed-rate mortgage (FRM) averaged 6.51%. This is up from last week, when it averaged 6.36%. In May 2025, the 30-year FRM averaged 6.86%.

    “The 30-year fixed-rate mortgage averaged 6.51% this week,” said Sam Khater, Freddie Mac’s Chief Economist. “As rates fluctuate, aspiring buyers should remember that by shopping around for the best mortgage rate and getting multiple quotes, they can potentially save thousands.”

    The 15-year FRM averaged 5.85%, up from last week when it averaged 5.71%. A year ago at this time, the 15-year FRM averaged 6.01%.

    Read More

  • Housing affordability increases in Q1 2026

    Housing affordability increases in Q1 2026

    Housing affordability conditions for first-time and entry-level buyers are improving at a reasonable pace. According to the National Association of Home Builders’ (NAHB) Wells Fargo Cost of Housing Index (CHI), in Q1 of 2026 the income share needed to buy a new home dropped 4% from Q2 2025.

    Despite mortgage rate changes and overall economic uncertainty, this exhibits promising signs for housing affordability for everyday Americans. The trend continues to existing homes, where income share needed to purchase dropped from 37% in Q2 2025 to 32% in Q1 2026.

    “The U.S. data for the percentage of earnings needed to purchase a new home in the first quarter is based on a national median new home price of $403,200 and median income of $106,800, said Rose Quint, assistant vice president for survey research at NAHB. “The first quarter median new home price is down slightly from $405,300 in the fourth quarter of 2025.”

    Read More 

  • Pending home sales see 1.4% increase

    Pending home sales see 1.4% increase

    According to a report from the National Association of Realtors (NAR), the spring housing market saw a slight bump in activity in April, as pending home sales increased by 1.4% since March. Pending sales increased in the Northeast, Midwest and West, but declined in the South. Year-over-year pending home sales rose in the Midwest, South and West, but declined in the Northeast.

    The report, released on May 19, 2026, follows the release of data indicating that the National Association of Home Builders/Wells Fargo sentiment index notched a 3-point gain in May.

    “Buyers are coming out with cautious optimism despite increasing economic uncertainty and a slight rise in mortgage rates,” said NAR Chief Economist Lawrence Yun. “Demand will easily be even higher once mortgage rates retreat to the levels they were at earlier this year.”

    Read More

  • U.S. home prices rose 0.2% in April

    U.S. home prices rose 0.2% in April

    U.S. home prices rose 0.2% month over month in April on a seasonally adjusted basis and climbed 2.1% year over year. The Redfin Home Price Index, which uses the repeat-sales pricing method to calculate seasonally adjusted changes in single-family home prices, found that, overall, improving homebuyer demand could fuel further price gains in the coming months.

    “An improving labor market is buoying homebuyer demand, which is keeping home price growth afloat,” said Redfin Senior Economist Asad Khan. “Even though prices are rising, buyers still have bargaining power because they’re outnumbered by sellers. If housing demand keeps climbing, sellers may regain some of that power, causing home prices to rise further.”

    In Montgomery County, Pa., home prices climbed 2.5% month over month on a seasonally adjusted basis in April; the biggest increase among the U.S. metropolitan areas.

    Read More